Fig. 6
Download original image
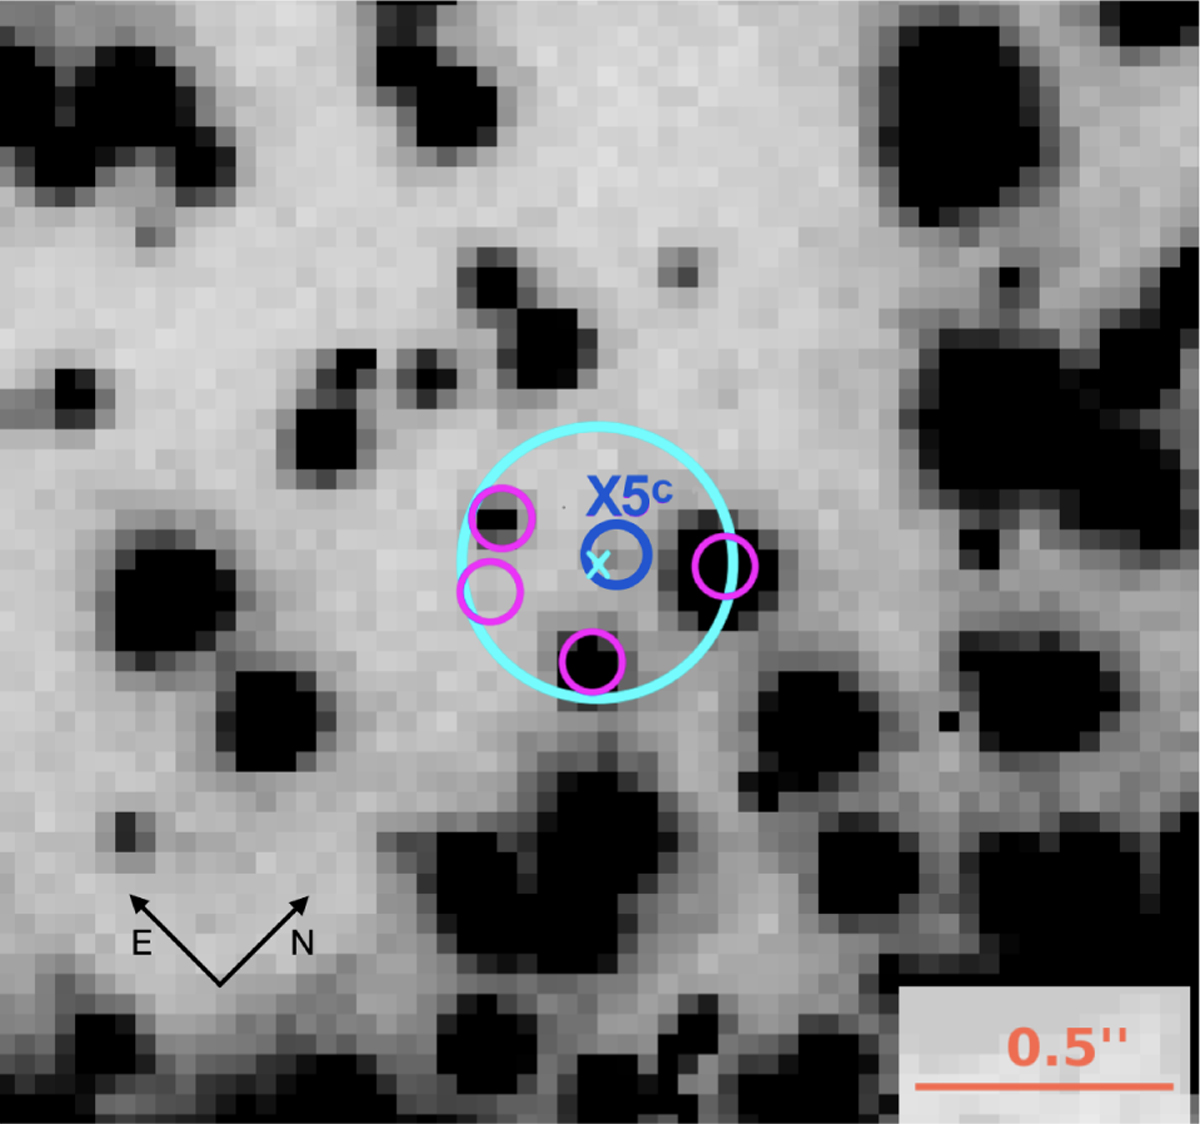
Finding chart for source X5 in the F390W WFC3 band covering an area of 2.4′′ on each side. The cyan circle is centred on the X-ray position, indicated by a cyan cross, and it has a radius equal to the X-ray position uncertainty uncX. The magenta circles denote the positions of the candidate counterparts. We mark in blue the candidate counterpart X5c, which is the same as the one presented in Figs. 3 and 7.
Current usage metrics show cumulative count of Article Views (full-text article views including HTML views, PDF and ePub downloads, according to the available data) and Abstracts Views on Vision4Press platform.
Data correspond to usage on the plateform after 2015. The current usage metrics is available 48-96 hours after online publication and is updated daily on week days.
Initial download of the metrics may take a while.