Fig. 5
Download original image
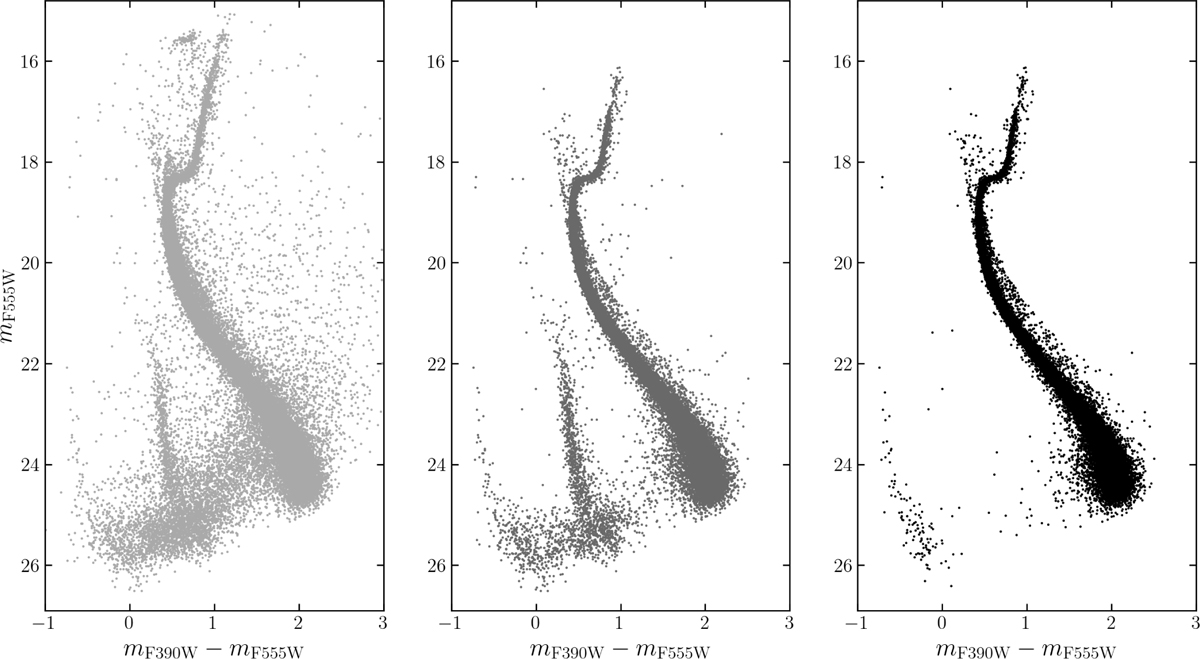
Data selection process schematically illustrated in (mF555W, mF390W−mF555W) CMDs. The left panel shows the observed CMD, including all detected stars. The middle panel shows the cleaned CMD after photometric quality cuts. The fraction of stars removed according to photometric quality cuts is 0.53. It can be observed that the stars in the upper part of the RGB and those on the horizontal branch are excluded after the photometric quality cuts, which is a result of saturation. The right panel shows the final CMD after membership selection. The fraction of stars removed according to membership evaluation with respect to the complete catalogue shown in the first panel is 0.05.
Current usage metrics show cumulative count of Article Views (full-text article views including HTML views, PDF and ePub downloads, according to the available data) and Abstracts Views on Vision4Press platform.
Data correspond to usage on the plateform after 2015. The current usage metrics is available 48-96 hours after online publication and is updated daily on week days.
Initial download of the metrics may take a while.