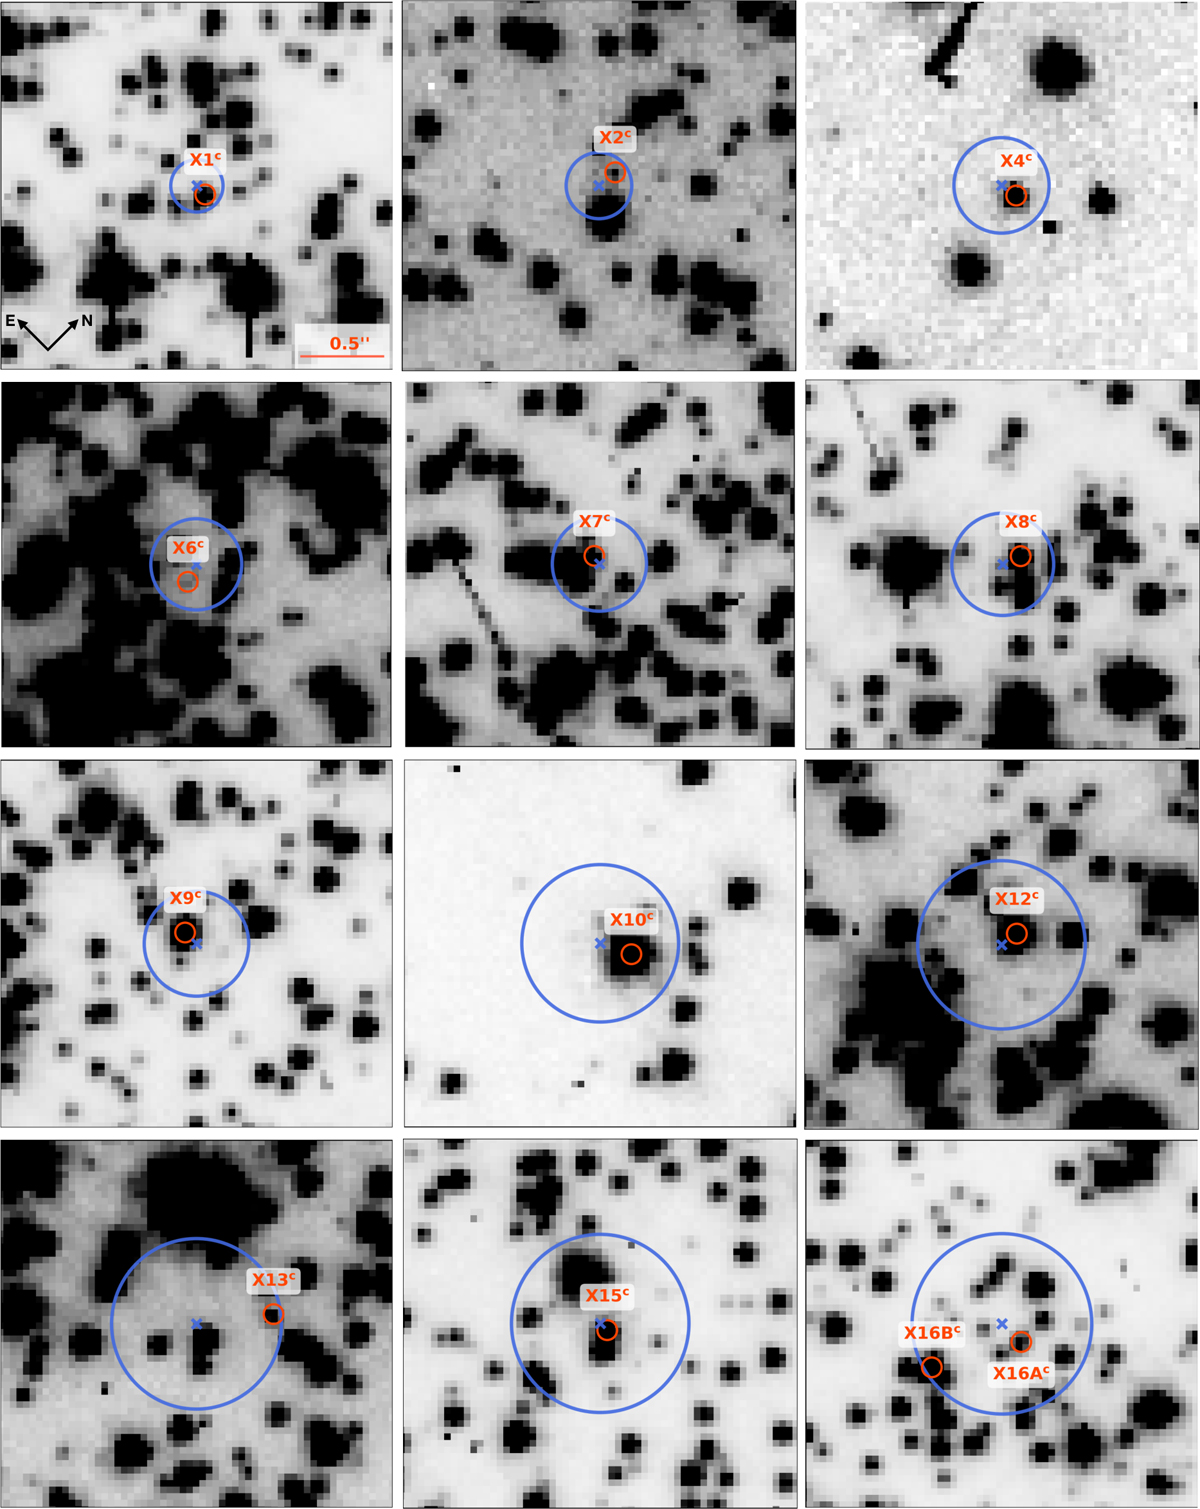
Fig. B.1
Download original image
Finding charts of our high-confidence counterparts. Each square covers an area of 2.4′′ on each side. In each panel, the X-ray source position is indicated by a blue cross, along with a blue circle whose radius represents the uncertainty in the X-ray position, uncX. The red circle marks the location of the optical counterpart. All the finding charts are oriented in the same way as indicated by the arrows in the first finding chart for X1c.
Current usage metrics show cumulative count of Article Views (full-text article views including HTML views, PDF and ePub downloads, according to the available data) and Abstracts Views on Vision4Press platform.
Data correspond to usage on the plateform after 2015. The current usage metrics is available 48-96 hours after online publication and is updated daily on week days.
Initial download of the metrics may take a while.