Fig. 10
Download original image
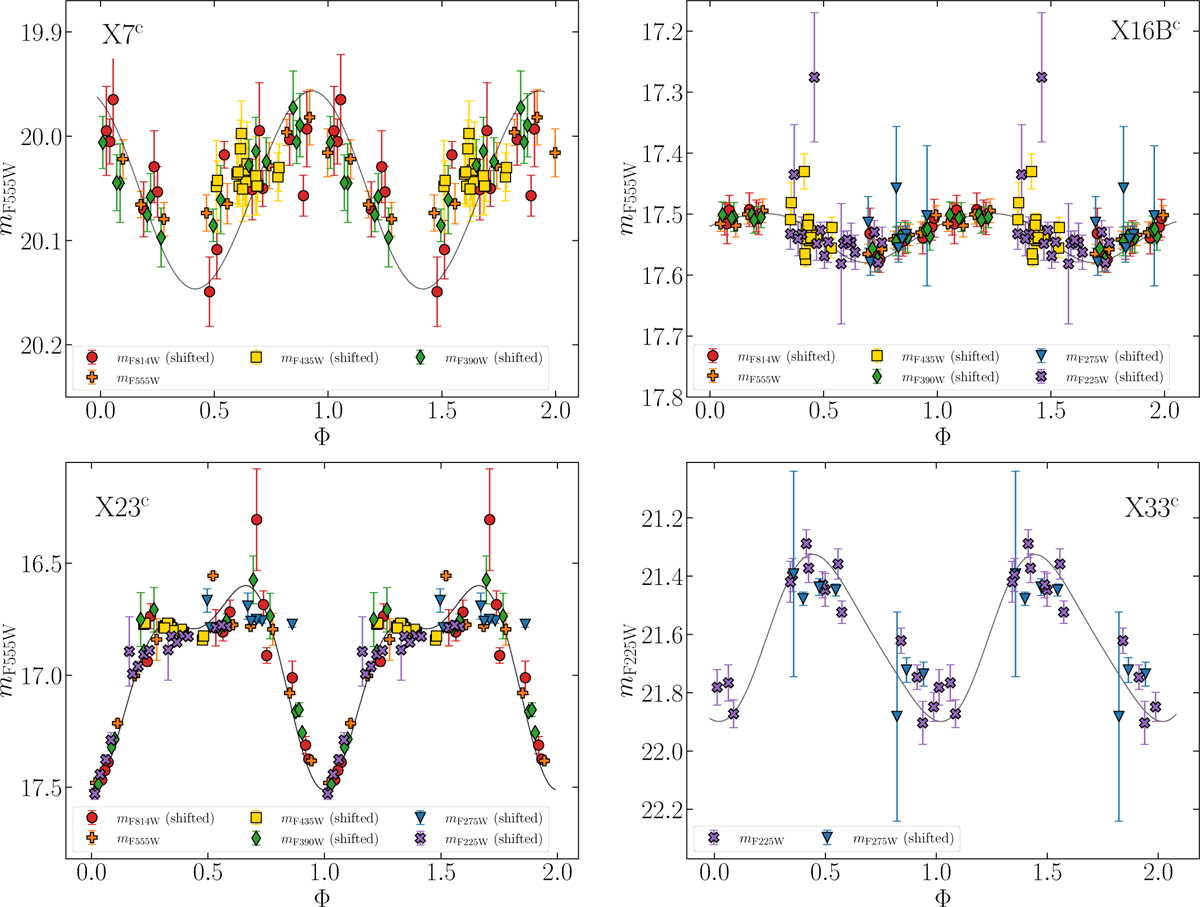
From left to right, top to bottom: Global light curves of X7c, X16Bc, X23c, and X33c. The light curve of X7c does not show mF225w and mF275W measurements for clarity. The curves are folded using periods of 8.89 hours, 13.44 hours, 9.53 hours and 3.10 hours respectively, determined from Lomb-Scargle analysis performed on the global curves across all available filters. In each panel, the grey solid line is a combination of sines and cosines fitted to the data points with the only purpose of helping the visualisation of the light curve.
Current usage metrics show cumulative count of Article Views (full-text article views including HTML views, PDF and ePub downloads, according to the available data) and Abstracts Views on Vision4Press platform.
Data correspond to usage on the plateform after 2015. The current usage metrics is available 48-96 hours after online publication and is updated daily on week days.
Initial download of the metrics may take a while.