Fig. C.1.
Download original image
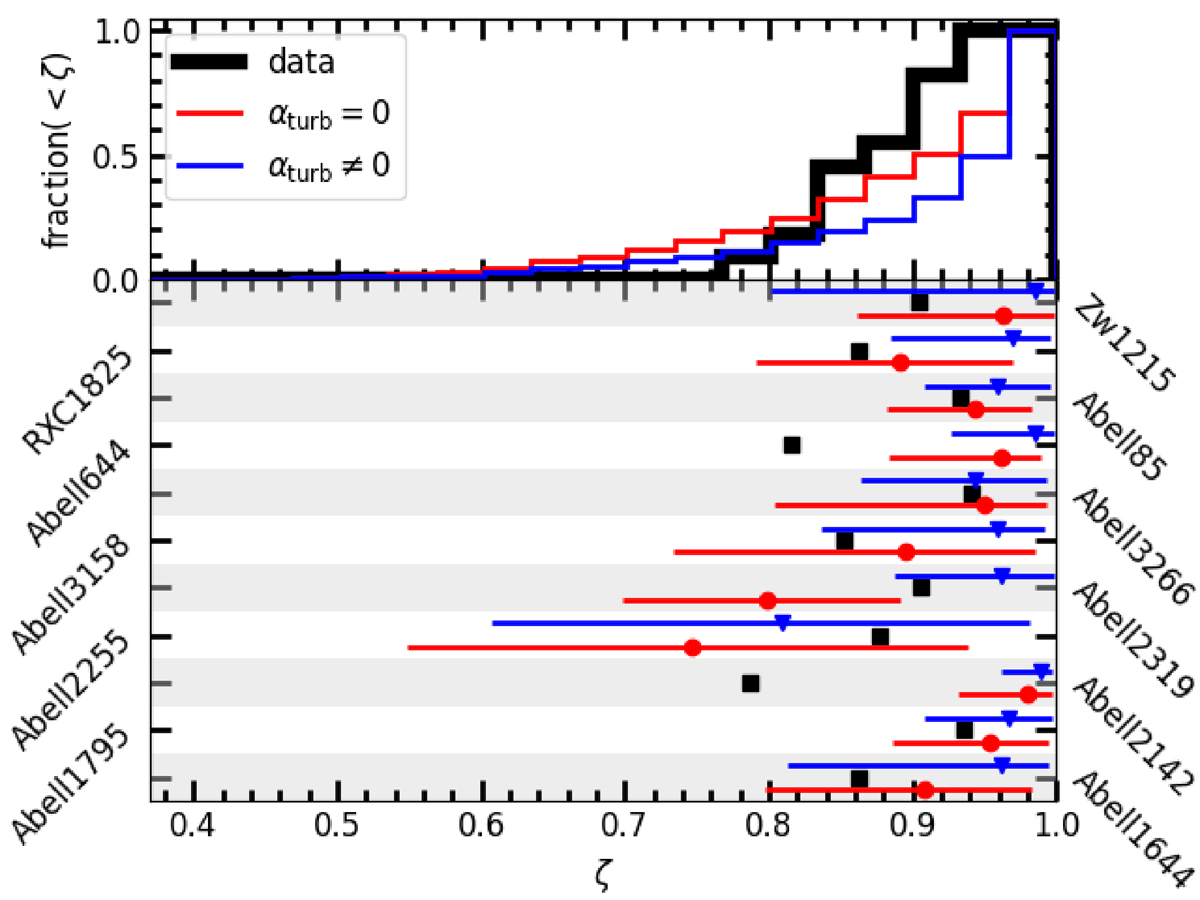
Observed and model axial ratio, ζ, of the X-ray surface-brightness distributions of the clusters of our sample. Upper panel: Observed distribution of ζ (black) compared to the distributions of ζ of the αturb = 0 (red) and αturb ≥ 0 (blue) models. Lower panel: Observed (squares) ζ compared with the median values of ζ obtained for each cluster (as indicated in the vertical axis) for the αturb = 0 (circles) and αturb ≥ 0 (triangles) models. The error bars indicate the 16th and 84th percentiles measured in our models. The observed data points have very small 1σ uncertainties (δζ/ζ ∼ 10−3), which are not shown in the plot.
Current usage metrics show cumulative count of Article Views (full-text article views including HTML views, PDF and ePub downloads, according to the available data) and Abstracts Views on Vision4Press platform.
Data correspond to usage on the plateform after 2015. The current usage metrics is available 48-96 hours after online publication and is updated daily on week days.
Initial download of the metrics may take a while.