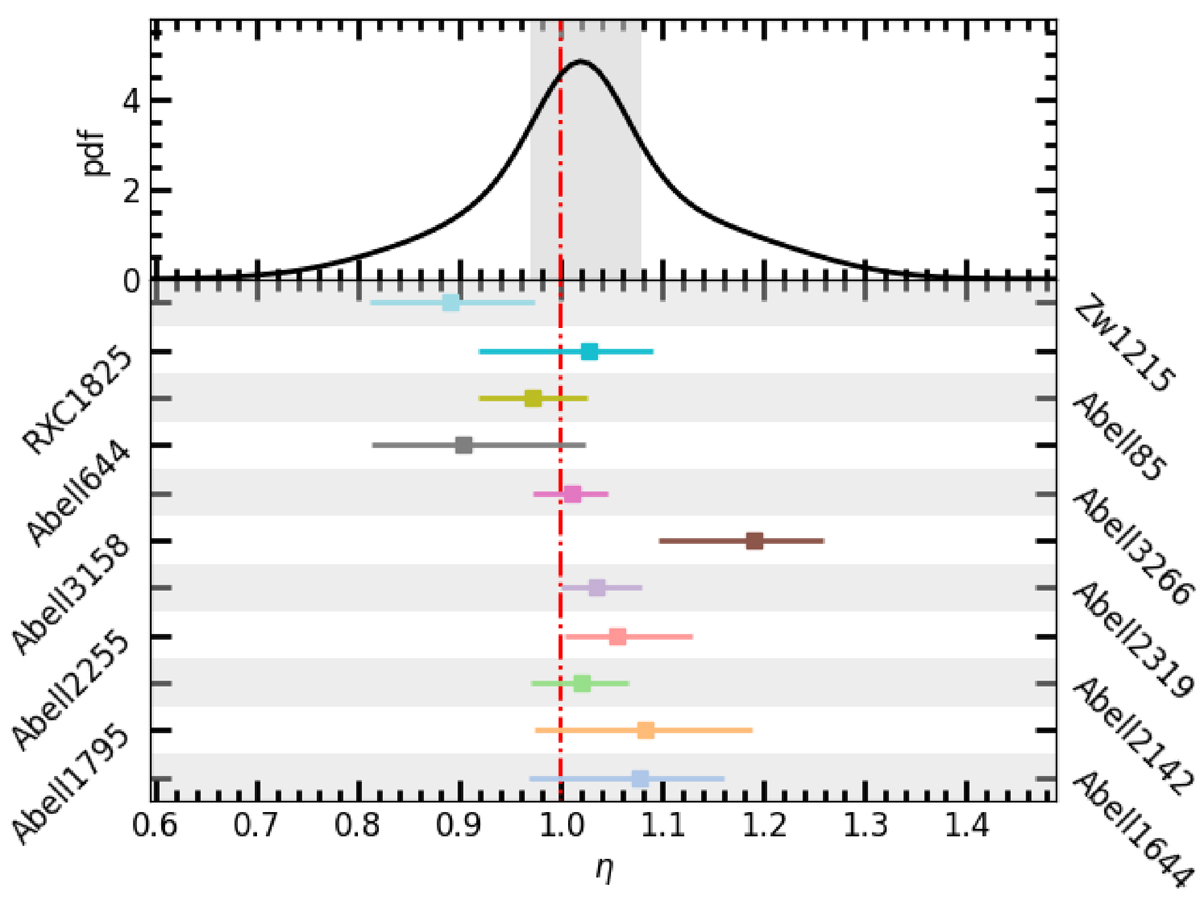
Fig. A.1.
Download original image
Upper panel: Probability density function (pdf) of the systematic offset parameter, η, in our cluster sample. The gray band ranges between the 16th and 84th percentile of η in the entire sample. Bottom panel: Median η of each cluster (as indicated in the vertical axes) according to the αturb ≥ 0 model, with error bars corresponding to the 16th and 84th percentiles. For reference, η = 1 (no offset) is indicated with a red vertical line.
Current usage metrics show cumulative count of Article Views (full-text article views including HTML views, PDF and ePub downloads, according to the available data) and Abstracts Views on Vision4Press platform.
Data correspond to usage on the plateform after 2015. The current usage metrics is available 48-96 hours after online publication and is updated daily on week days.
Initial download of the metrics may take a while.