Fig. 2.
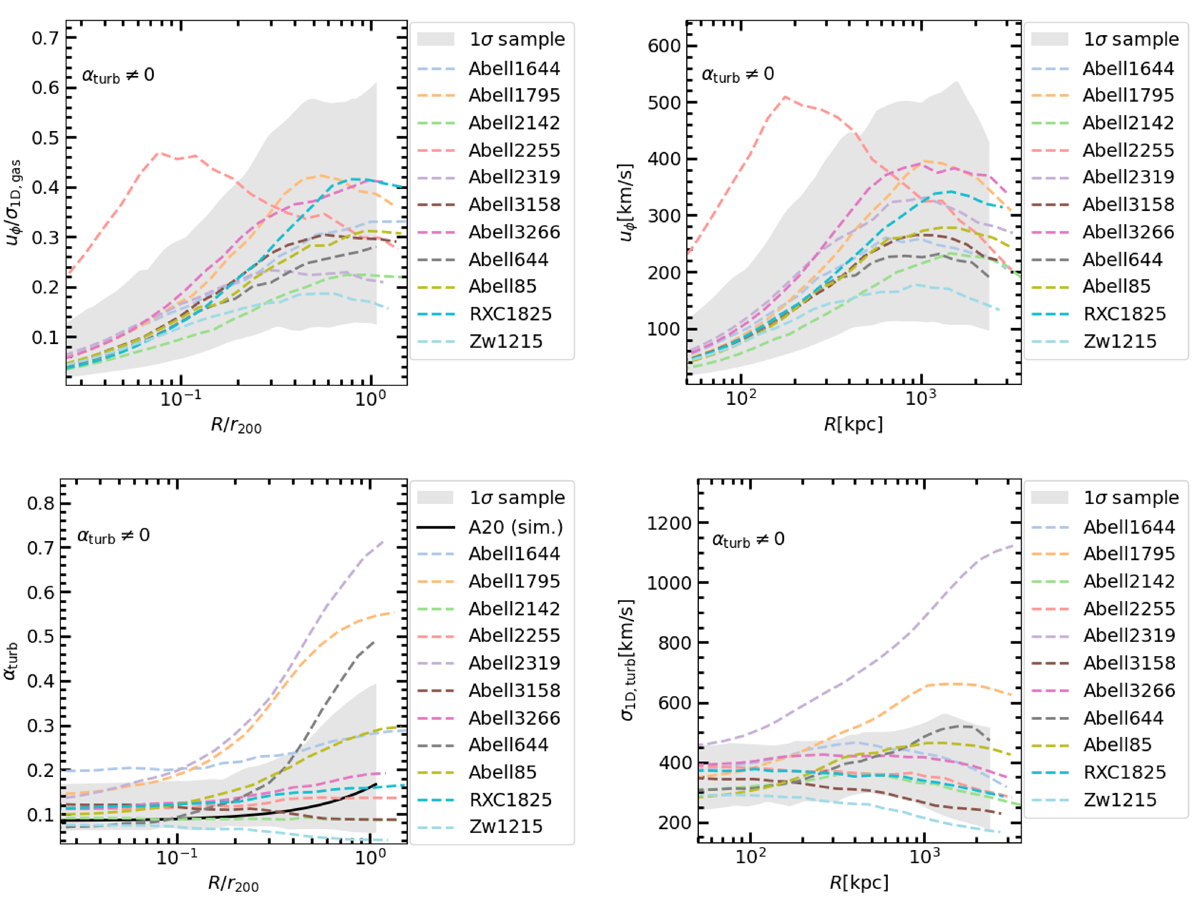
Download original image
Equatorial plane rotation and turbulence profiles of the ICM in the αturb ≠ 0 models of the clusters of our sample. Upper panels: Same as Fig. 1 but for models with αturb ≥ 0. Lower left panel: Median turbulent-to-total pressure ratio, αturb, as a function of the cylindrical radius normalized to the virial radius, r200 (see the caption of Fig. 1), for the same models as in the upper panels. Lower right panel: 1D turbulent velocity dispersion as a function of the cylindrical radius in physical units for the same models as in the upper panels. The color coding and the meaning of the gray bands are the same as in Fig. 1. In the lower right panel, we overplot the αturb profile measured in simulations by A20 (solid black line; the profile was taken from their Eq. (11), with a0, a1, and a2 equal to their best-fit values, as reported in the first row of their Table 1, and assuming r200, m/r200 ≈ 1.67).
Current usage metrics show cumulative count of Article Views (full-text article views including HTML views, PDF and ePub downloads, according to the available data) and Abstracts Views on Vision4Press platform.
Data correspond to usage on the plateform after 2015. The current usage metrics is available 48-96 hours after online publication and is updated daily on week days.
Initial download of the metrics may take a while.