Fig. 1.
Download original image
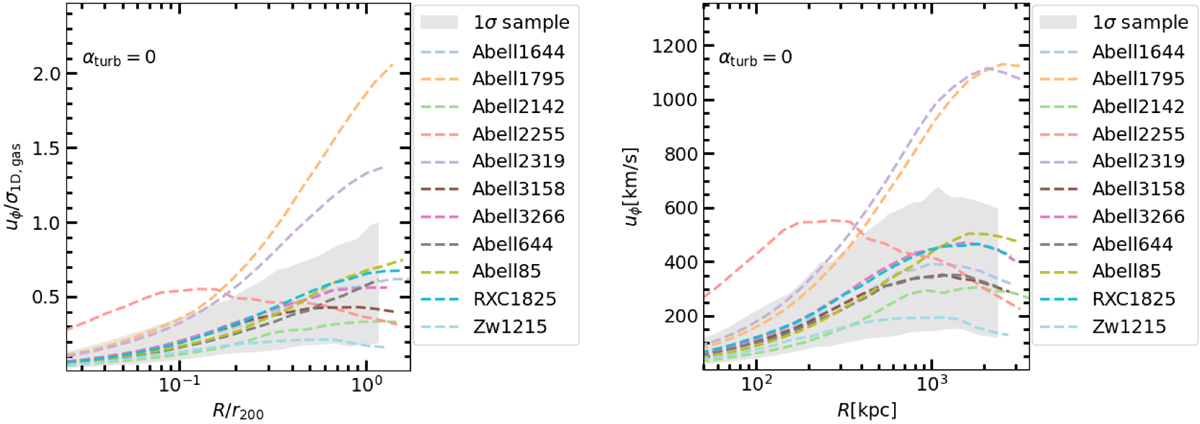
Equatorial plane velocity profiles of the ICM in the αturb = 0 models of the clusters of our sample. Left panel: Ratio between the gas rotation velocity and velocity dispersion (measured in the equatorial plane) as a function of the cylindrical radius normalized to the virial radius, r200 = 3M200/[800πρcrit]1/3, computed using the median value of M200 for each cluster. Right panel: Gas rotation velocity as a function of the cylindrical radius in physical units. In both panels the dashed lines are the median profiles of the individual clusters (as indicated in the legend), whereas the gray band represents the interval between the 16th and 84th percentiles of the distribution of the profiles of the entire sample of clusters.
Current usage metrics show cumulative count of Article Views (full-text article views including HTML views, PDF and ePub downloads, according to the available data) and Abstracts Views on Vision4Press platform.
Data correspond to usage on the plateform after 2015. The current usage metrics is available 48-96 hours after online publication and is updated daily on week days.
Initial download of the metrics may take a while.