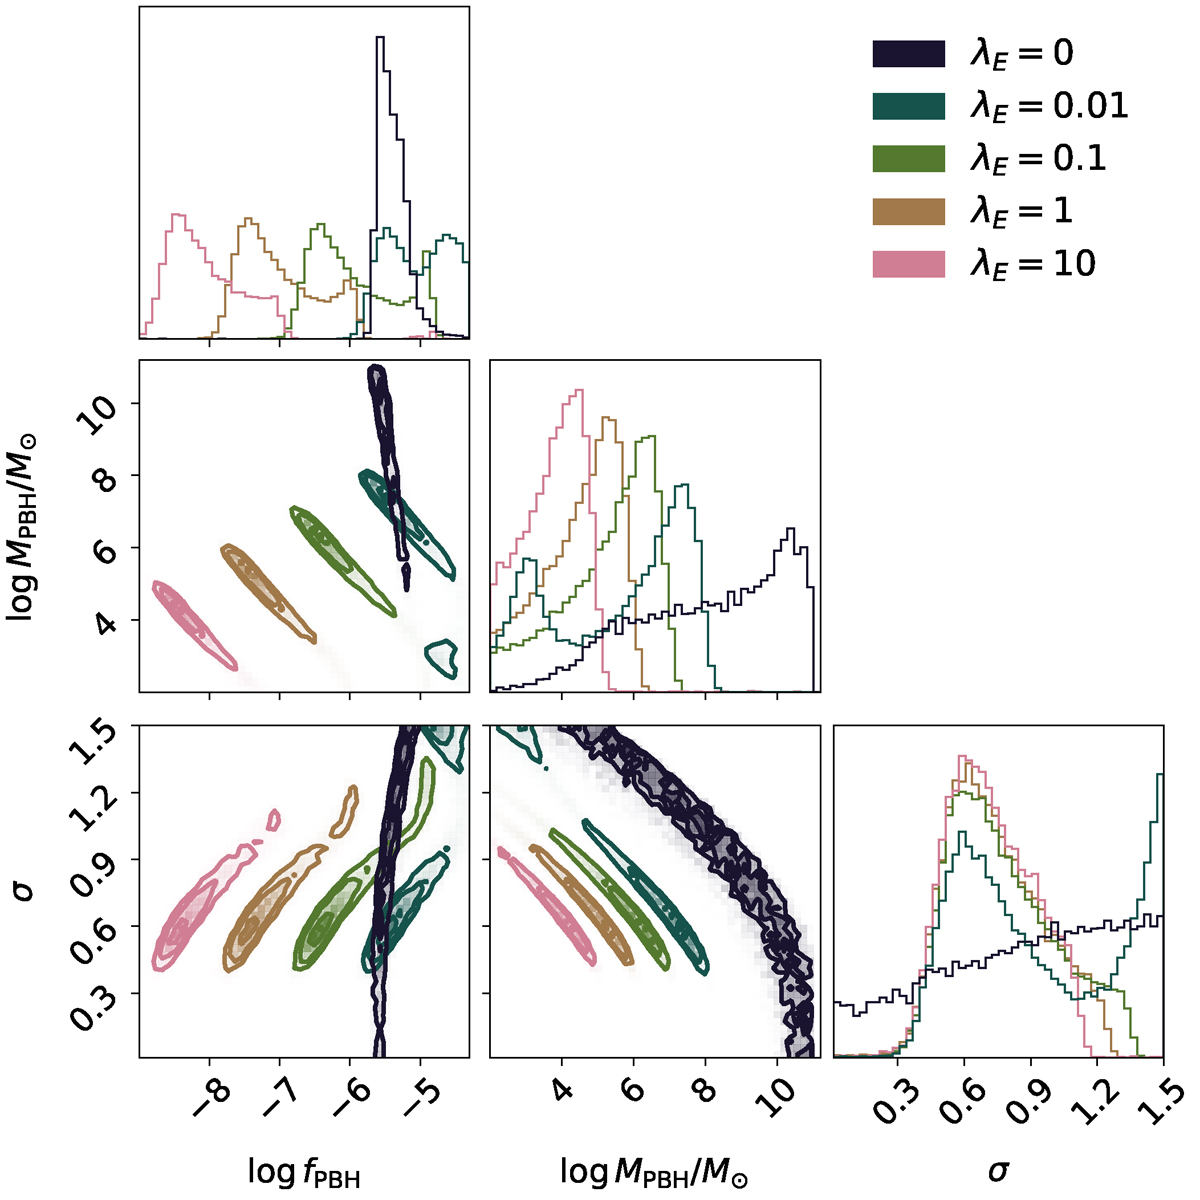
Fig. B.1.
Download original image
Corner plot of the posterior for the PBH models (Sec. 2). The parameters describing the mass function of the PBHs (eq. 2) are obtained via the MCMC using constraints at z = 11 and assuming PBHs are distributed independently of halo mass. Each color corresponds to a value for λE, as reported in the legend. An interesting feature to note is that, as long as λE > 0.01, changing λE shifts the posterior distribution, as indicated in eq. 10. Tabulated results are reported in Tab. 1.
Current usage metrics show cumulative count of Article Views (full-text article views including HTML views, PDF and ePub downloads, according to the available data) and Abstracts Views on Vision4Press platform.
Data correspond to usage on the plateform after 2015. The current usage metrics is available 48-96 hours after online publication and is updated daily on week days.
Initial download of the metrics may take a while.