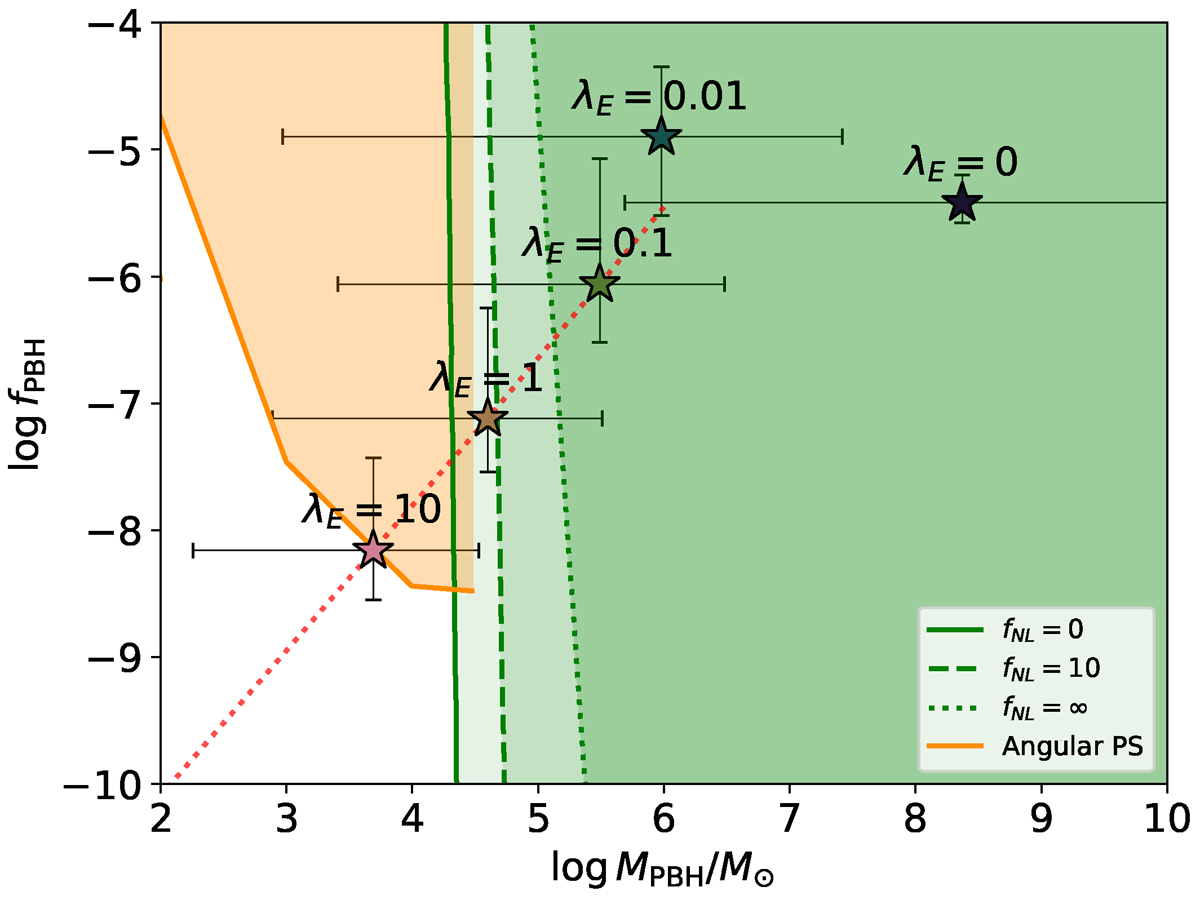
Fig. 5.
Download original image
PBH parameter exclusion plot in the fPBH − mPBH plane. We plot the constraint on the monochromatic PBH abundance from the CMB μ-distortion absence (Nakama et al. 2018, green lines) within different non-Gaussianity scenarios (fNL = 0, 10, ∞ represented by the solid, dashed, and dotted lines, respectively) and the one from the observed CMB angular power spectrum (Serpico et al. 2020, orange line). The shaded regions are excluded, and their colors denote the violated limit (same color scheme as for the lines). The stars and error bars give the results and uncertainty for different values of λE (Tab. 1). The dotted red line traces the expected trend for varying λE when only an AGN contribution is present.
Current usage metrics show cumulative count of Article Views (full-text article views including HTML views, PDF and ePub downloads, according to the available data) and Abstracts Views on Vision4Press platform.
Data correspond to usage on the plateform after 2015. The current usage metrics is available 48-96 hours after online publication and is updated daily on week days.
Initial download of the metrics may take a while.