Fig. 1.
Download original image
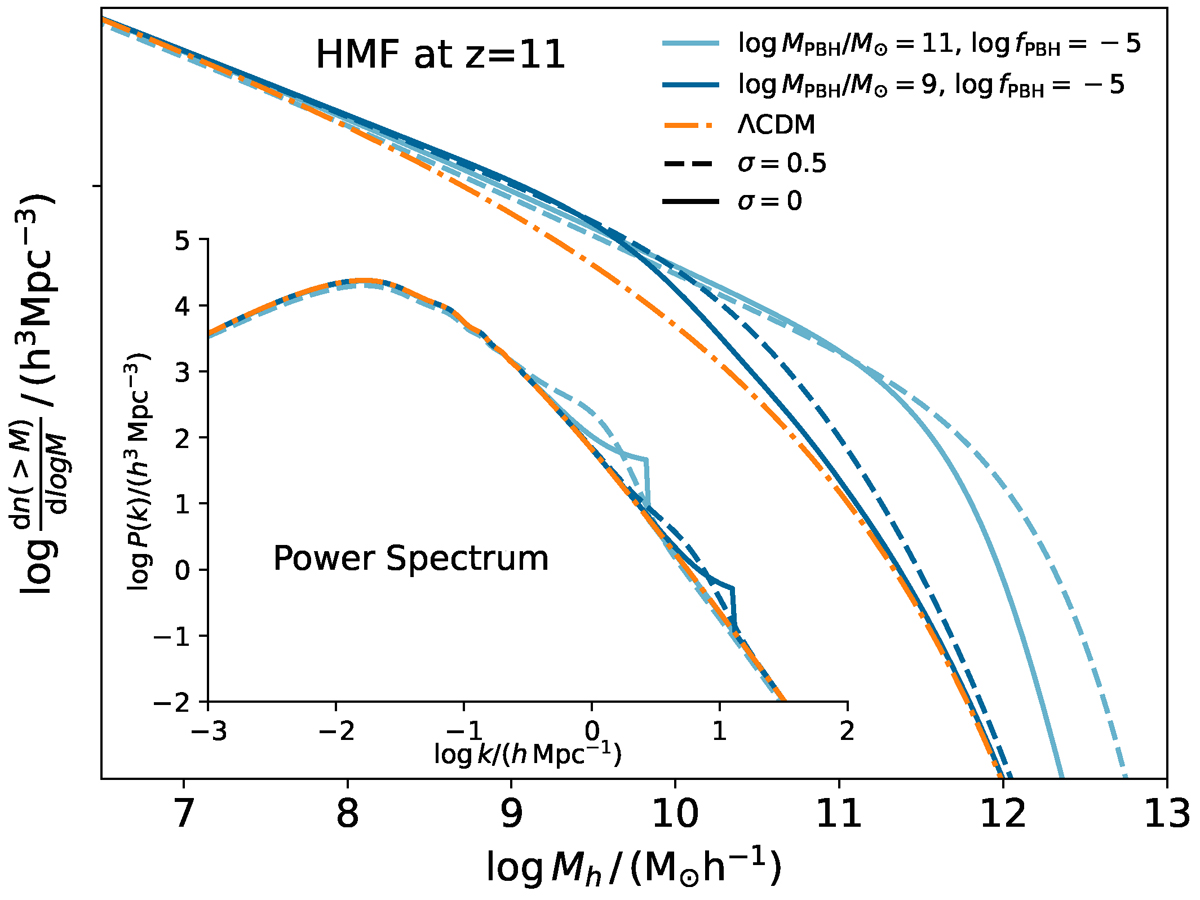
Overview of the modifications to the HMF due to the PBH contribution to the power spectrum. The Sheth & Tormen (2002) HMF (n) at z = 11 is plotted as a function of halo mass (Mh) for a pure ΛCDM cosmology and for PBHs with lognormal mass functions, constituting a fraction fPBH = 10−5 of the total dark matter density; each color corresponds to a different PBH mass MPBH = 109 M⊙, 1011 M⊙, whereas continuous (dashed) lines represent monochromatic (lognormal with σ = 0.5) mass functions. For reference, we show the corresponding power spectra at z = 0 (PCDM, Eq. 1) as a function of the wavenumber (k) as an inset.
Current usage metrics show cumulative count of Article Views (full-text article views including HTML views, PDF and ePub downloads, according to the available data) and Abstracts Views on Vision4Press platform.
Data correspond to usage on the plateform after 2015. The current usage metrics is available 48-96 hours after online publication and is updated daily on week days.
Initial download of the metrics may take a while.