Fig. 12.
Download original image
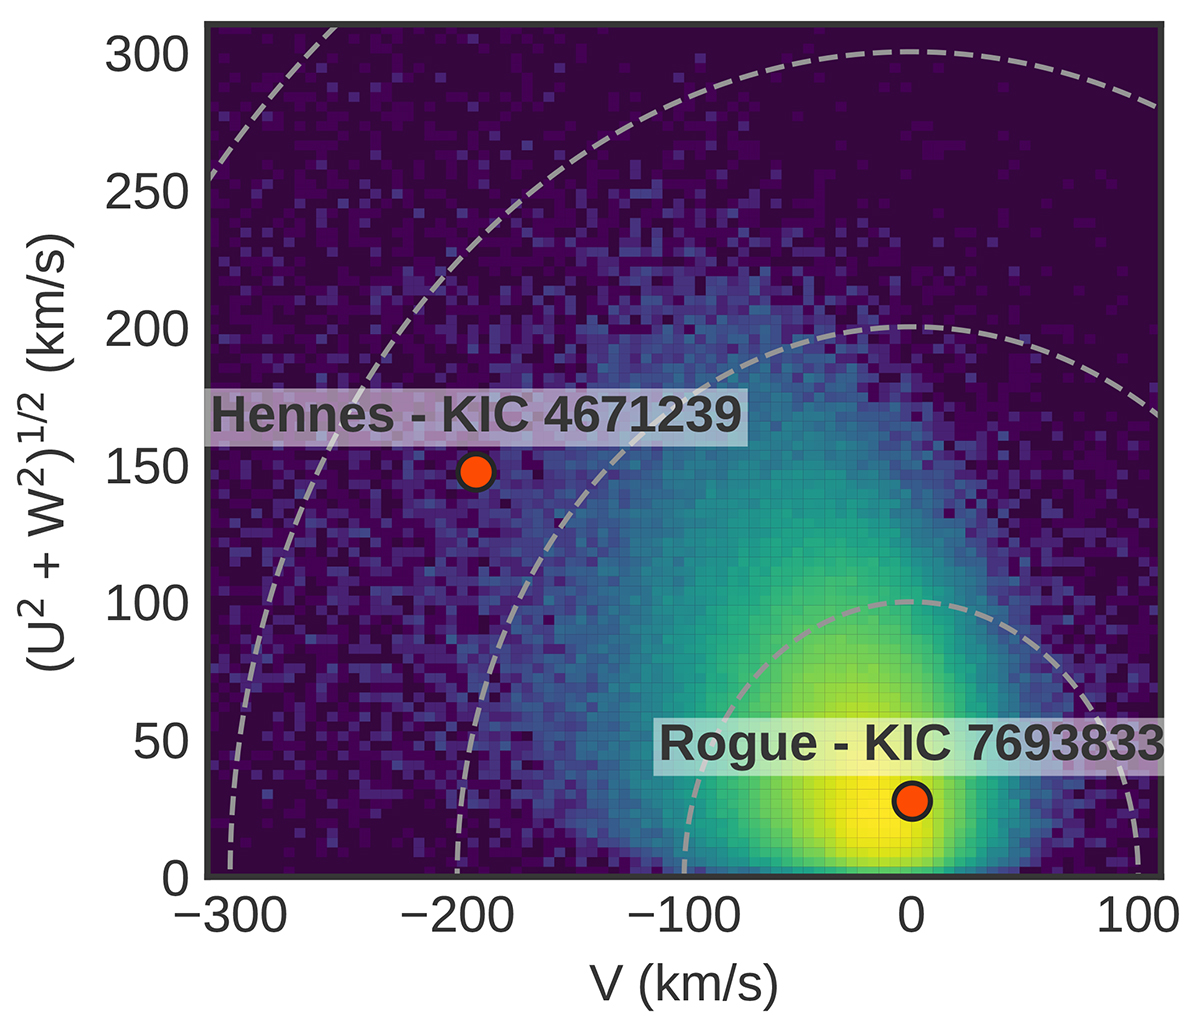
Toomre diagram showing the Galactic velocity components. The vertical axis represents motion perpendicular to the plane and the horizontal axis depicts motion within the plane. The location of Hennes and Rogue in this space are marked with red dots. The background density map represents the number count of single targets from Gaia DR3 with reliable astrometric data and available line-of-sight velocities (astrometric_params_solved = 95, non_single_star = 0, ruwe < 1.4, and rv_nb_transits > 0).
Current usage metrics show cumulative count of Article Views (full-text article views including HTML views, PDF and ePub downloads, according to the available data) and Abstracts Views on Vision4Press platform.
Data correspond to usage on the plateform after 2015. The current usage metrics is available 48-96 hours after online publication and is updated daily on week days.
Initial download of the metrics may take a while.