Fig. 10.
Download original image
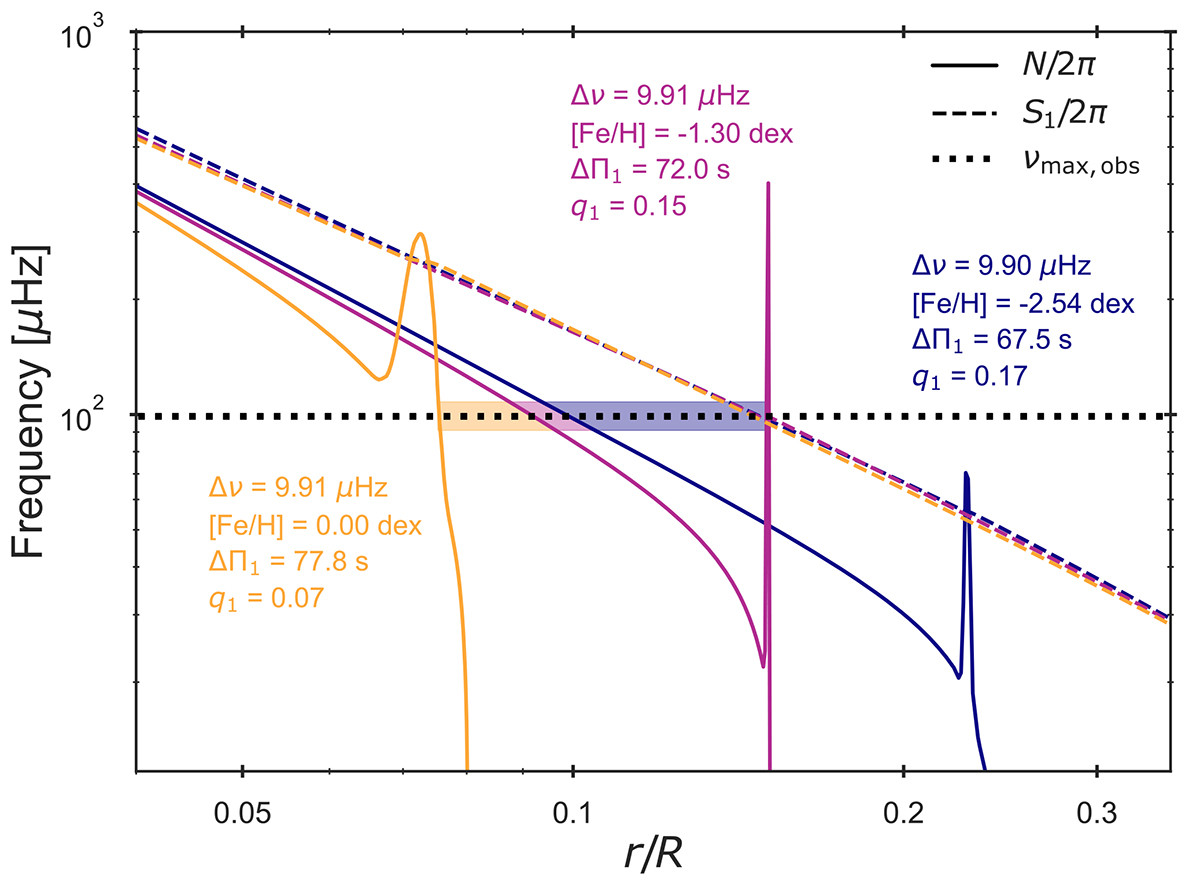
Propagation diagram for three stellar models depicting the characteristic frequencies in the interior near the lower convective boundary. The best-fitting model of Hennes is plotted alongside two models of similar evolutionary state, i.e. similar Δν value, with identical initial parameters except for a variation in [Fe/H]. The shaded region around the observed νmax of Hennes represents the extent of the evanescent region for the three models, which increases with metallicity.
Current usage metrics show cumulative count of Article Views (full-text article views including HTML views, PDF and ePub downloads, according to the available data) and Abstracts Views on Vision4Press platform.
Data correspond to usage on the plateform after 2015. The current usage metrics is available 48-96 hours after online publication and is updated daily on week days.
Initial download of the metrics may take a while.