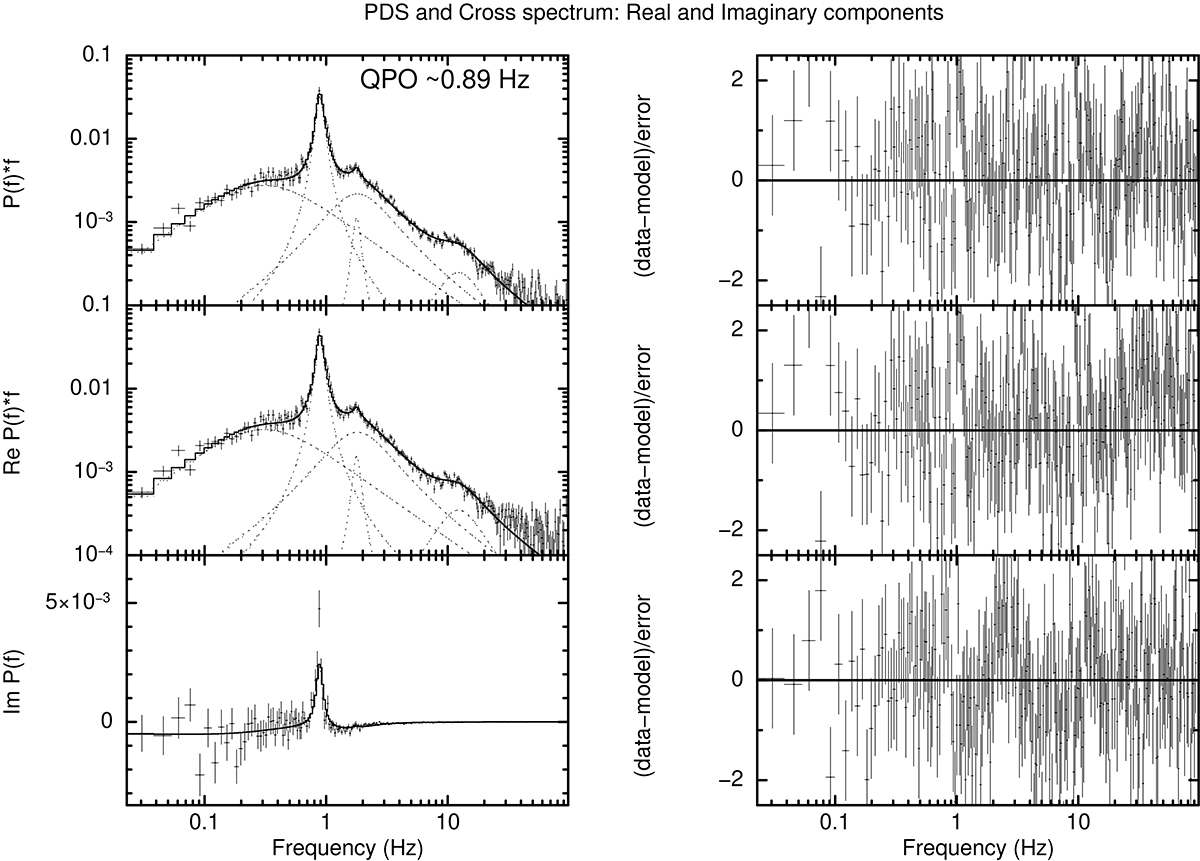
Fig. 3.
Download original image
Top left panel displays the 0.5–10.0 keV power density spectrum of Swift J1727.8–1613, fitted with five Lorentzians for ObsID 6203980105. The middle and bottom left panels show the real and imaginary parts of the cross spectrum between the 0.5–2.0 keV and 2.0–10.0 keV bands, along with the best-fitting model that assumes that the phase lags of each Lorentzians are constant with Fourier frequency (see Méndez et al. 2024). The right-hand panels display the residuals of the fits for the respective spectra.
Current usage metrics show cumulative count of Article Views (full-text article views including HTML views, PDF and ePub downloads, according to the available data) and Abstracts Views on Vision4Press platform.
Data correspond to usage on the plateform after 2015. The current usage metrics is available 48-96 hours after online publication and is updated daily on week days.
Initial download of the metrics may take a while.