Fig. 1.
Download original image
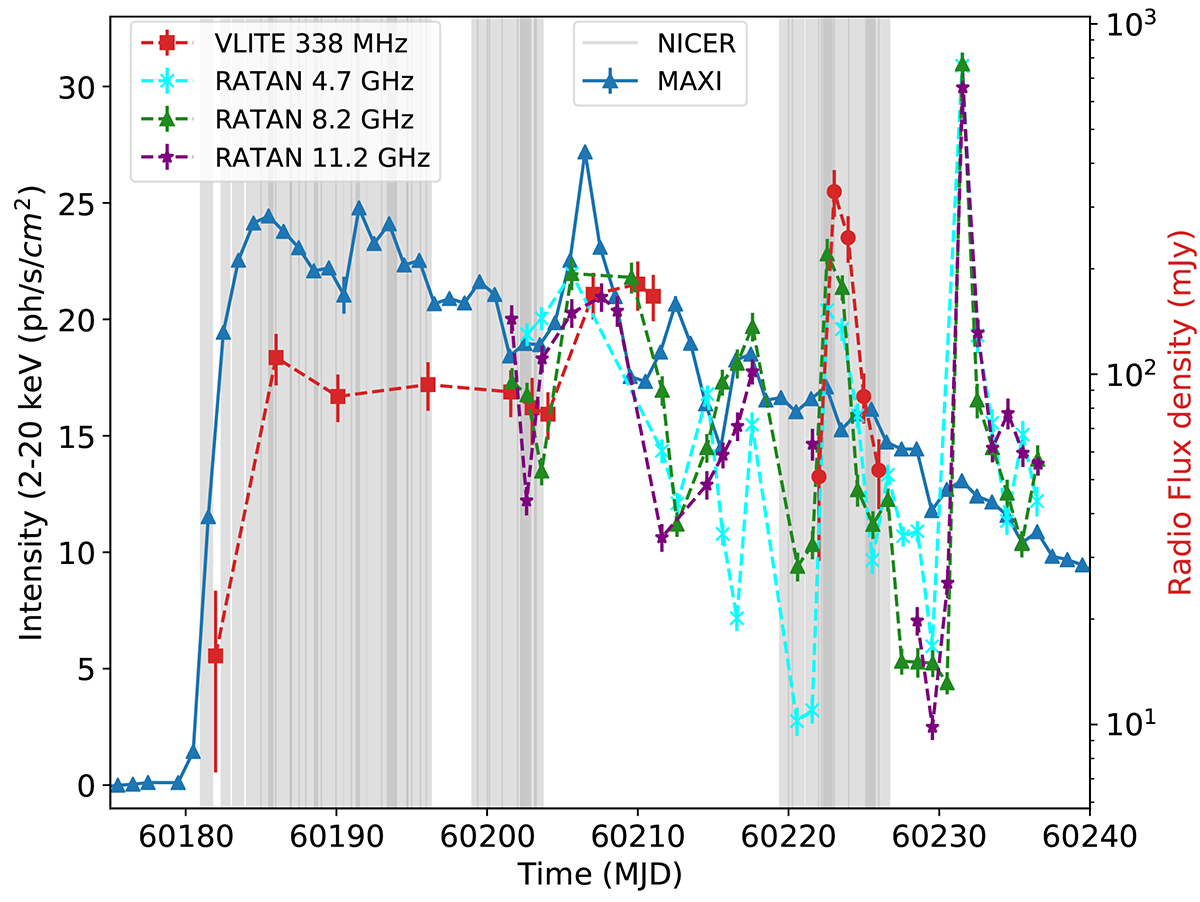
MAXI light curve of Swift J1727.8–1613 starting from 60175 MJD (August 19, 2023) in the 2–20 keV energy band in units of photons s−1 cm−2 (blue triangles; left y axis). The right y-axis shows the radio flux density in mJy from the VLA Low-band Ionosphere and Transient Experiment (VLITE) at 338 MHz (red data points, data from Peters et al. 2023), alongside RATAN-600 observations at frequencies of 4.7 GHz (cyan data points), 8.2 GHz (green data points), and 11.2 GHz (purple data points, data from Ingram et al. 2024).
Current usage metrics show cumulative count of Article Views (full-text article views including HTML views, PDF and ePub downloads, according to the available data) and Abstracts Views on Vision4Press platform.
Data correspond to usage on the plateform after 2015. The current usage metrics is available 48-96 hours after online publication and is updated daily on week days.
Initial download of the metrics may take a while.