Fig. 18
Download original image
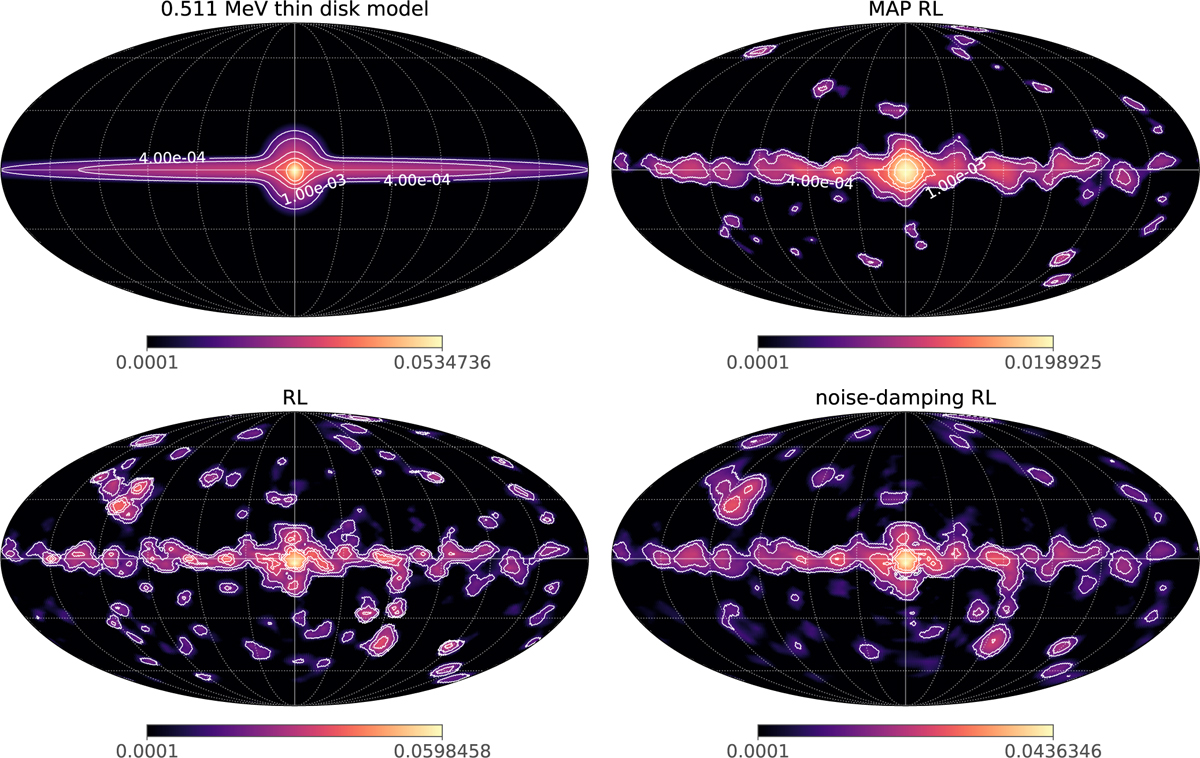
Comparison between the reconstructed 0.511 MeV images with different methods. The images are in the unit of ph/cm2/s/sr. The top left shows the injected thin model, while the reconstructed images with the proposed method, the conventional RL, and the RL using a Gaussian filter are shown on the top right, bottom left, and bottom right panels, respectively. Following the same discussion in Section 5.2.1, each pixel suffers from the Poisson fluctuation of ∼1000 background events (= 2.09 × 10⁶/3072) with a typical exposure of 3.5 × 105 cm2 s sr on a pixel, which corresponds to a noise level of ∼10−4 ph cm−2 s−1 sr−1 in the reconstructed image.
Current usage metrics show cumulative count of Article Views (full-text article views including HTML views, PDF and ePub downloads, according to the available data) and Abstracts Views on Vision4Press platform.
Data correspond to usage on the plateform after 2015. The current usage metrics is available 48-96 hours after online publication and is updated daily on week days.
Initial download of the metrics may take a while.