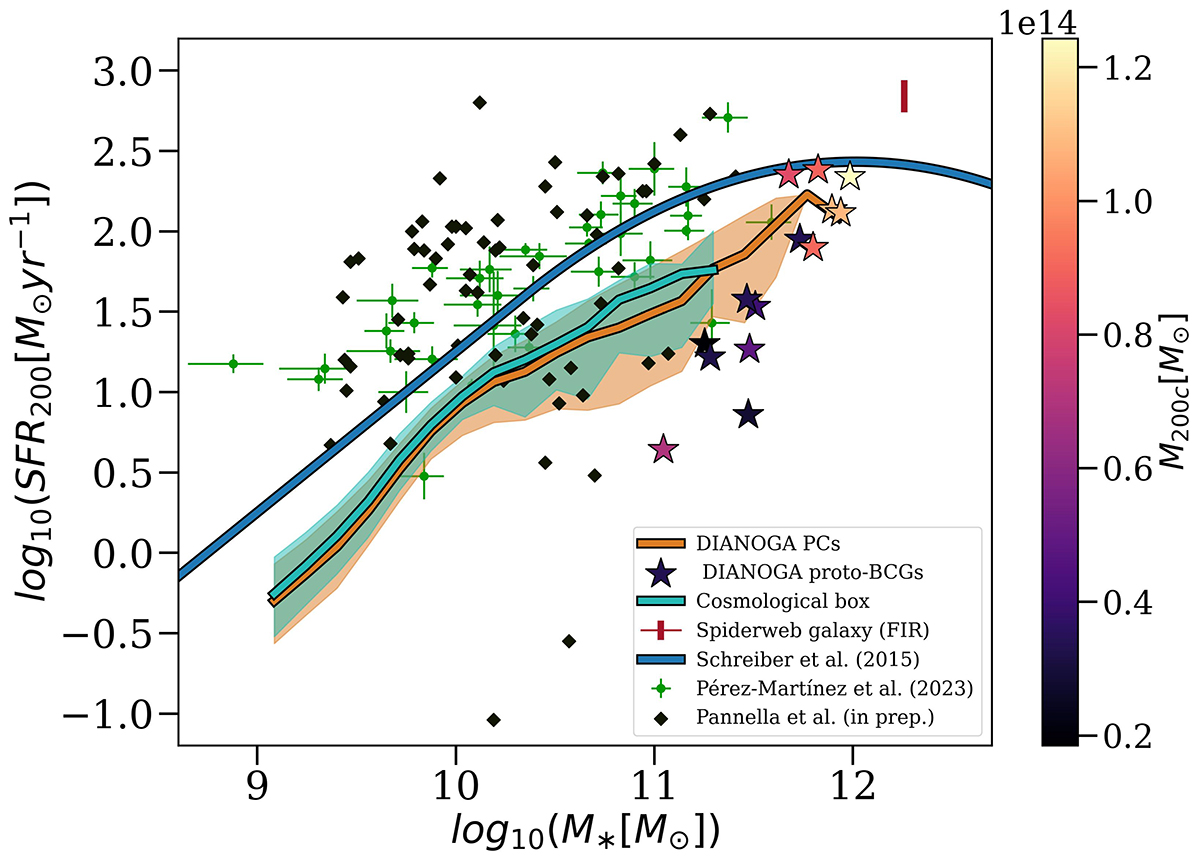
Fig. 8.
Download original image
Star-forming MS of galaxies in the DIANOGA PCs (orange) and in the cosmological box (green). Solid lines define the median SFRs of all star-forming galaxies within each stellar mass bin, while the shaded areas mark the 16th–84th percentile intervals. The star symbols represent proto-BCGs identified in the simulations, color coded according to the mass M200c of the main progenitor halo of each PC. Black diamonds and green dots are data for the Spiderweb PC from Pannella et al. (in prep.) and from Pérez-Martínez et al. (2023), respectively. The blue line is the best fit for the observed field star-forming MS by Schreiber et al. (2015) at z = 2.2. The red bar shows the estimated SFRs for the Spiderweb galaxy from measurements by Seymour et al. (2012) and Drouart et al. (2014). Simulated SFRs are averaged over 200 Myr (see text).
Current usage metrics show cumulative count of Article Views (full-text article views including HTML views, PDF and ePub downloads, according to the available data) and Abstracts Views on Vision4Press platform.
Data correspond to usage on the plateform after 2015. The current usage metrics is available 48-96 hours after online publication and is updated daily on week days.
Initial download of the metrics may take a while.