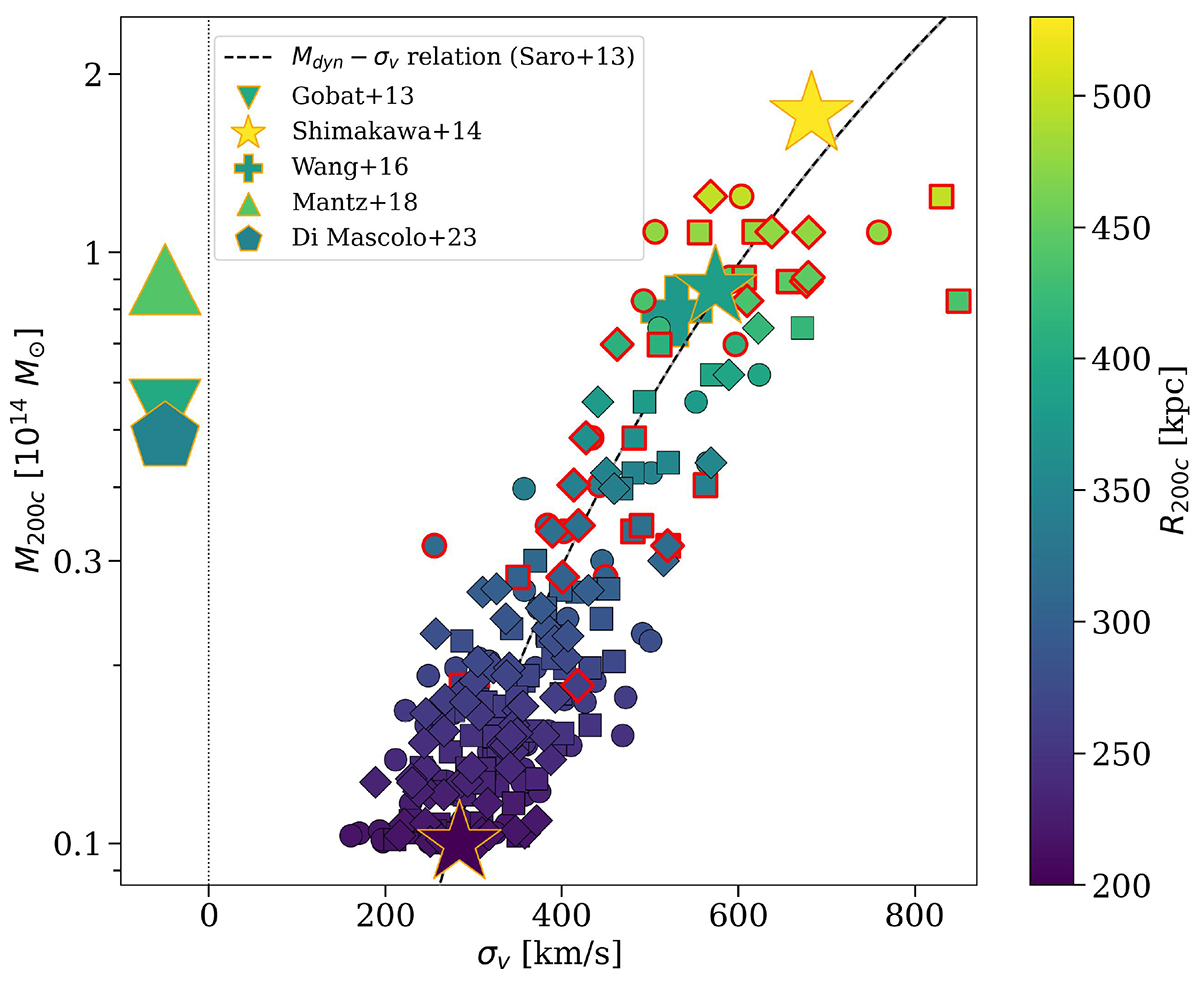
Fig. 4.
Download original image
Mass M200c of massive halos in PC regions as a function of velocity dispersion σv along three orthogonal lines of sight (represented by circles, squares and diamonds) as traced by galaxies with stellar masses larger than 109 M⊙ and lying within the R200c of each halo. Each point is color coded according to the halo R200c. The symbols with red contours mark the central halos of all PCs. The dashed curve represents the relation between dynamical masses and galaxy velocity dispersions calibrated in simulations by Saro et al. (2013) up to z = 1.2 and extrapolated at z = 2.2. Star symbols represent velocity dispersions and dynamical mass estimates within the core of the Spiderweb PC and for the two subgroups of USS1558-003 from Shimakawa et al. (2014). The cross symbol corresponds to CLJ1001 (Wang et al. 2016). The pentagon symbol shows M200c for the Spiderweb PC, from Sunyaev–Zeldovich effect measurements with the Atacama Large Millimeter/submillimeter Array (ALMA; Di Mascolo et al. 2023), the triangle represents the cluster XLSSC 122 (Mantz et al. 2018; Willis et al. 2020; Noordeh et al. 2021) and the downward triangle represents ClJ1449 (Gobat et al. 2013). These three points are shown artificially at σv < 0 since velocity dispersions measured consistently within the estimated radii are not available.
Current usage metrics show cumulative count of Article Views (full-text article views including HTML views, PDF and ePub downloads, according to the available data) and Abstracts Views on Vision4Press platform.
Data correspond to usage on the plateform after 2015. The current usage metrics is available 48-96 hours after online publication and is updated daily on week days.
Initial download of the metrics may take a while.