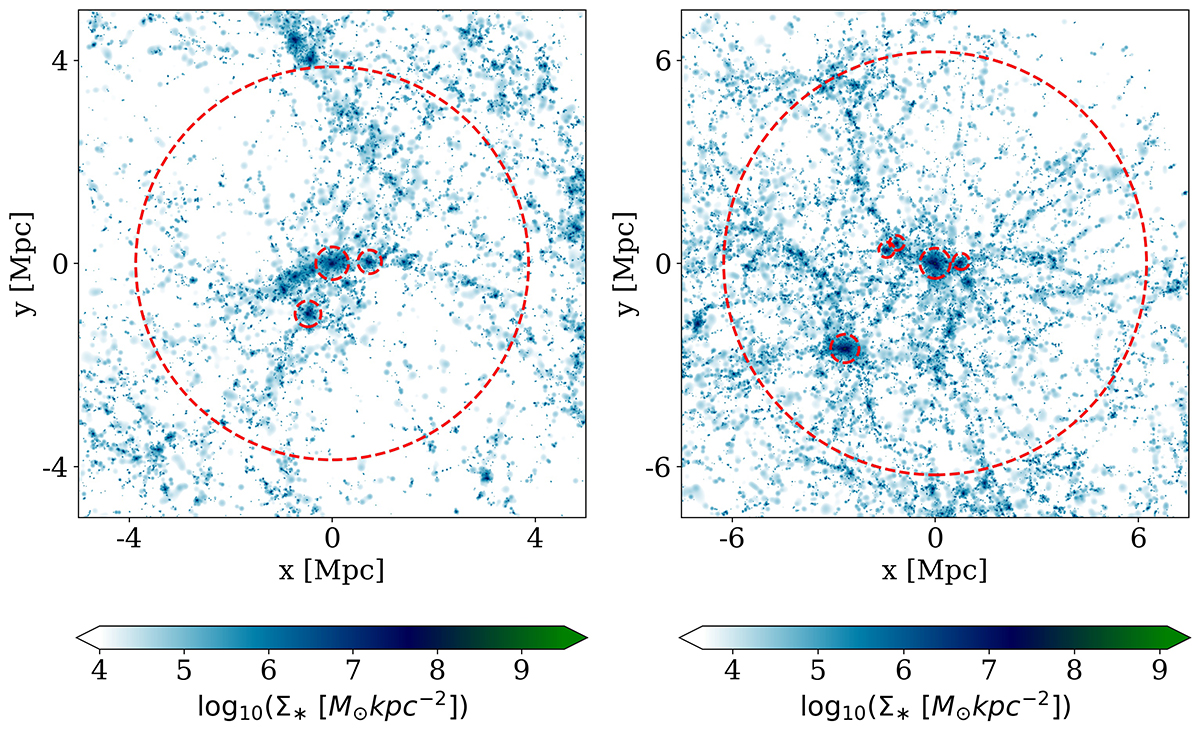
Fig. 3.
Download original image
Projected stellar mass density maps of two DIANOGA PC regions, which are the progenitors of clusters of total mass M200c equal to 5 × 10¹⁴ M⊙ and 2 × 10¹⁵ M⊙ at z = 0 (left and right panel, respectively). In each panel, the larger red dashed circle corresponds to the PC region as defined in the text, while the smaller circles show the R200c of halos in these regions with M200c > 1013 M⊙. Densities are computed in pixels of size 15 (10) kpc in the right (left) panel.
Current usage metrics show cumulative count of Article Views (full-text article views including HTML views, PDF and ePub downloads, according to the available data) and Abstracts Views on Vision4Press platform.
Data correspond to usage on the plateform after 2015. The current usage metrics is available 48-96 hours after online publication and is updated daily on week days.
Initial download of the metrics may take a while.