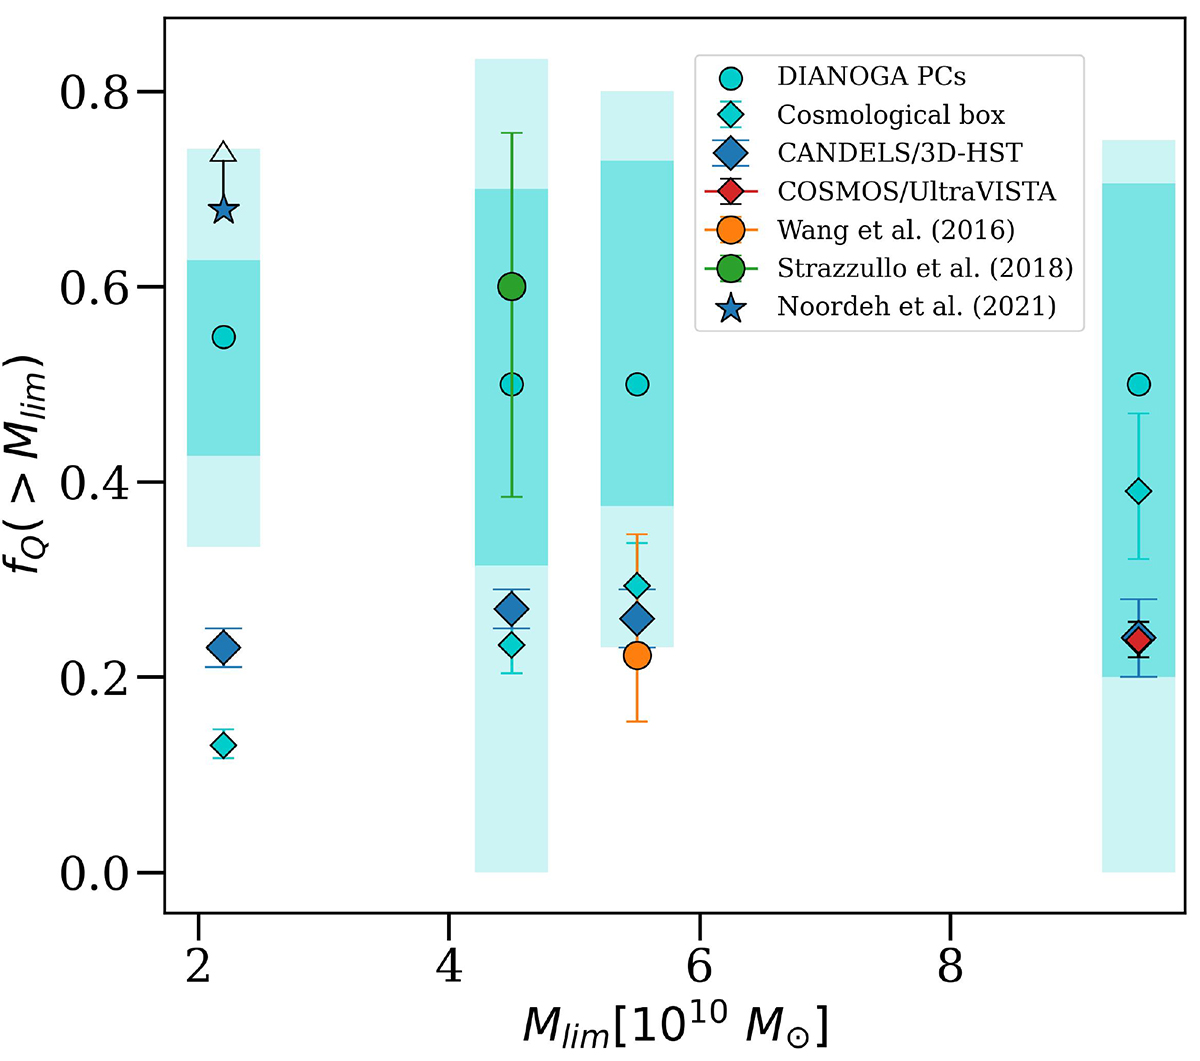
Fig. 13.
Download original image
Comparison of quenched fractions in the most massive simulated PC cores (with M200c ≥ 5 × 10¹³ M⊙) and observations at z ∼ 2 − 2.5. We note that measurements in this figure are not homogeneous in terms of the size of the considered region around the PC center (see text). The cyan dots show the median quenched fractions among selected halos, while shaded dark (light) regions are the 16th–84th percentile (minimum-maximum) ranges. The cyan diamonds, with binomial population uncertainties (Cameron 2011), are quenched fractions extracted from the cosmological box. For comparison with the observations in CLJ1001, XLSSC 122 and ClJ1449, galaxies in PCs were selected above a limiting stellar mass (Mlim) and within a physical aperture around halo centers, matching those adopted in Wang et al. (2016), Noordeh et al. (2021) and Strazzullo et al. (2018), respectively (see text for details). For comparison with the cosmological box, we also show the quenched fractions in the field from COSMOS/UltraVISTA catalog (Muzzin et al. 2013) and from the CANDELS/3D-HST survey (Skelton et al. 2014) at 2 < z < 2.5.
Current usage metrics show cumulative count of Article Views (full-text article views including HTML views, PDF and ePub downloads, according to the available data) and Abstracts Views on Vision4Press platform.
Data correspond to usage on the plateform after 2015. The current usage metrics is available 48-96 hours after online publication and is updated daily on week days.
Initial download of the metrics may take a while.