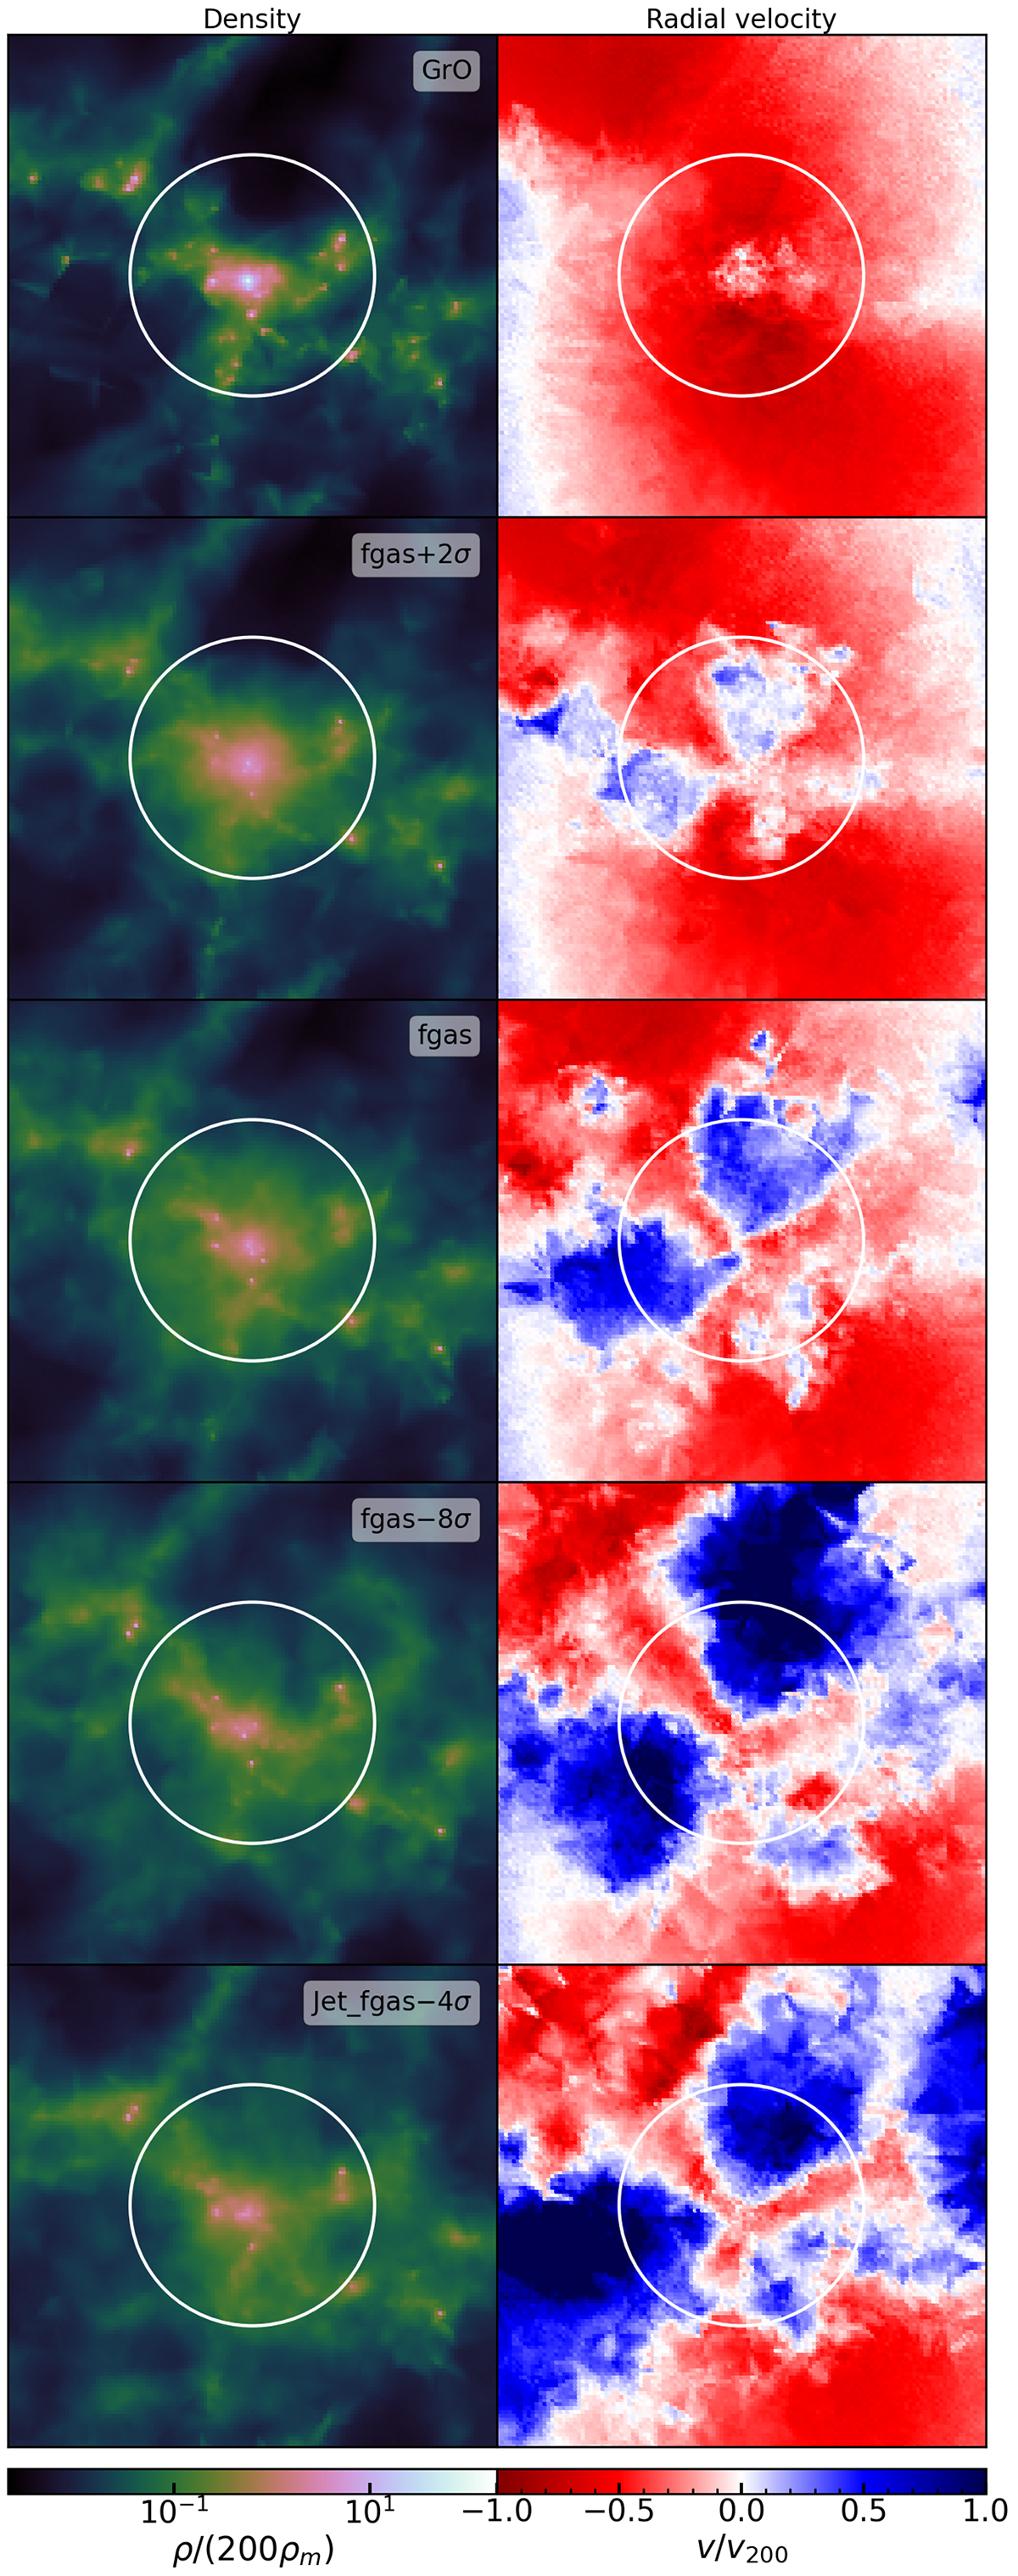
Fig. 8.
Download original image
Density (left) and radial velocity (right) fields around the same halo of MGrO = 1.00·1013 h−1 M⊙ and r200 = 500 h−1 kpc. The upper panel shows the halo in the gravity-only simulation, while all the others show the gas component of the halo in different feedback scenarios, with increasing strength from top to bottom. The panels show a region of ±10r200 around the halo centre, projecting a slice of thickness of 4r200. White circles represent a 5r200 radius. Positive (negative) radial velocities are shown in blue (red).
Current usage metrics show cumulative count of Article Views (full-text article views including HTML views, PDF and ePub downloads, according to the available data) and Abstracts Views on Vision4Press platform.
Data correspond to usage on the plateform after 2015. The current usage metrics is available 48-96 hours after online publication and is updated daily on week days.
Initial download of the metrics may take a while.