Fig. A.1.
Download original image
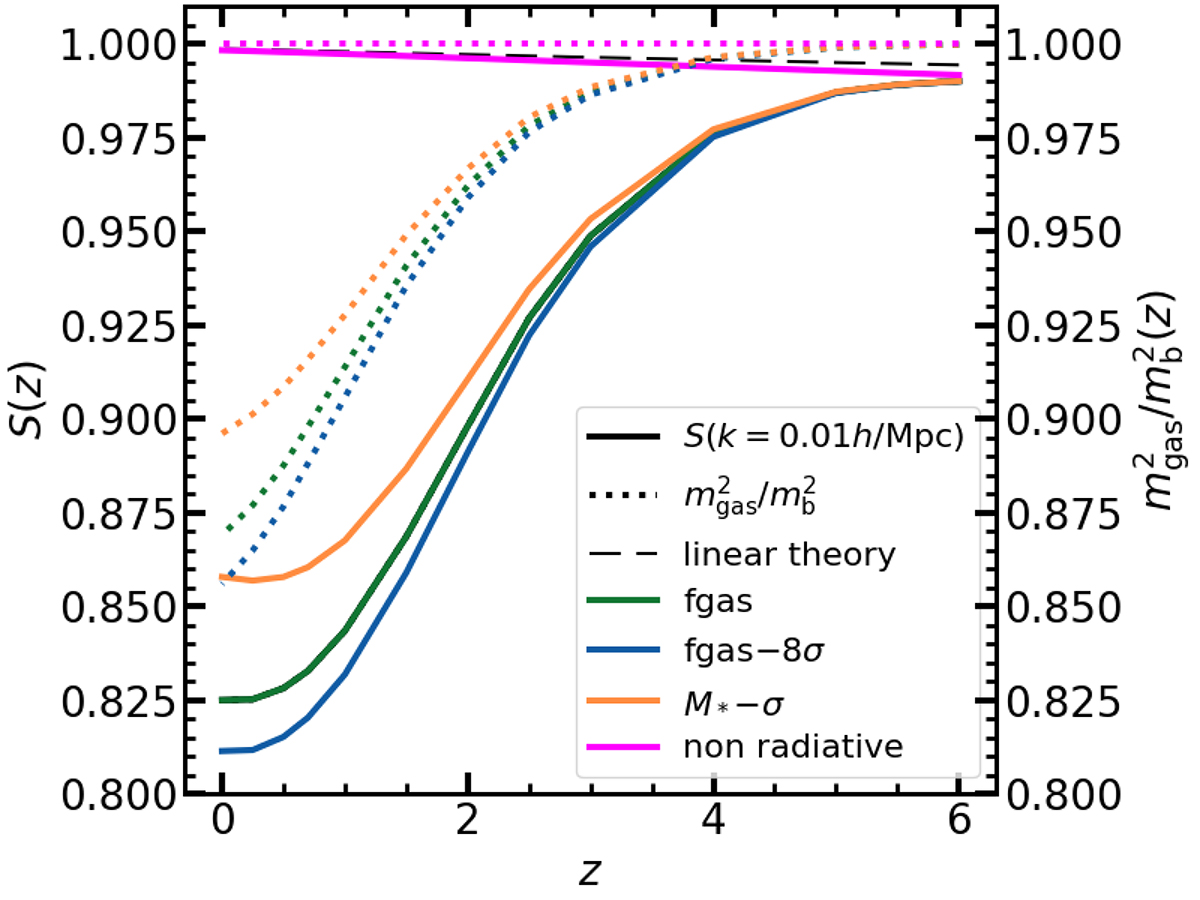
Split of the gas bias on its components: suppression of the gas power spectra (S(k = 0.01h/Mpc)) and the evolution of the total gas to baryon mass squared (![]() ). If the gas was not biased with respect to the gravity-only field, the solid lines should lie on top of the dotted lines. Solid lines: Redshift evolution of the suppression of gas power spectrum, as defined by the ratio of gas and gravity-only power spectra at k = 0.01hMpc. The gas power spectrum is normalised to the total baryon mass. In dashed lines, we plot the linear theory prediction for the baryon suppression. Dotted lines: Redshift evolution of the gas to baryon mass fraction squared, defined as the total mass in gas over total baryon mass. The colours denote different FLAMINGO runs.
). If the gas was not biased with respect to the gravity-only field, the solid lines should lie on top of the dotted lines. Solid lines: Redshift evolution of the suppression of gas power spectrum, as defined by the ratio of gas and gravity-only power spectra at k = 0.01hMpc. The gas power spectrum is normalised to the total baryon mass. In dashed lines, we plot the linear theory prediction for the baryon suppression. Dotted lines: Redshift evolution of the gas to baryon mass fraction squared, defined as the total mass in gas over total baryon mass. The colours denote different FLAMINGO runs.
Current usage metrics show cumulative count of Article Views (full-text article views including HTML views, PDF and ePub downloads, according to the available data) and Abstracts Views on Vision4Press platform.
Data correspond to usage on the plateform after 2015. The current usage metrics is available 48-96 hours after online publication and is updated daily on week days.
Initial download of the metrics may take a while.