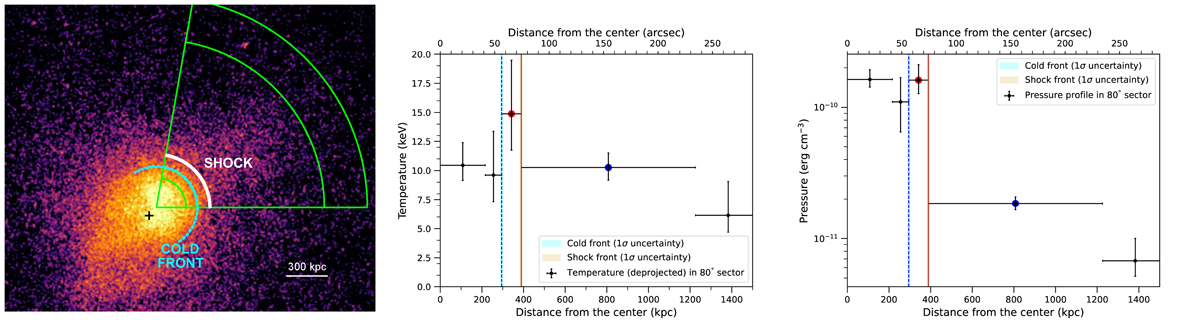
Fig. 9.
Download original image
Spectral analysis of the shock and cold fronts in PLCKG287. Left panel: mosaic [0.5–7.0] keV Chandra image of the central region of PLCKG287 smoothed with a kernel of 5 pixels showing the wedges used for the spectral analysis of the surface brightness edges. The white arc and the dashed cyan semicircle indicate the positions of the identified shock and cold front, respectively. Middle and right panels: deprojected temperature (middle) and pressure (right) profiles measured along the wedges shown in the left panel. The vertical lines show the position of the fronts identified in Sect. 4; in particular, the dashed blue line and solid red line indicate the cold front and shock, respectively.
Current usage metrics show cumulative count of Article Views (full-text article views including HTML views, PDF and ePub downloads, according to the available data) and Abstracts Views on Vision4Press platform.
Data correspond to usage on the plateform after 2015. The current usage metrics is available 48-96 hours after online publication and is updated daily on week days.
Initial download of the metrics may take a while.