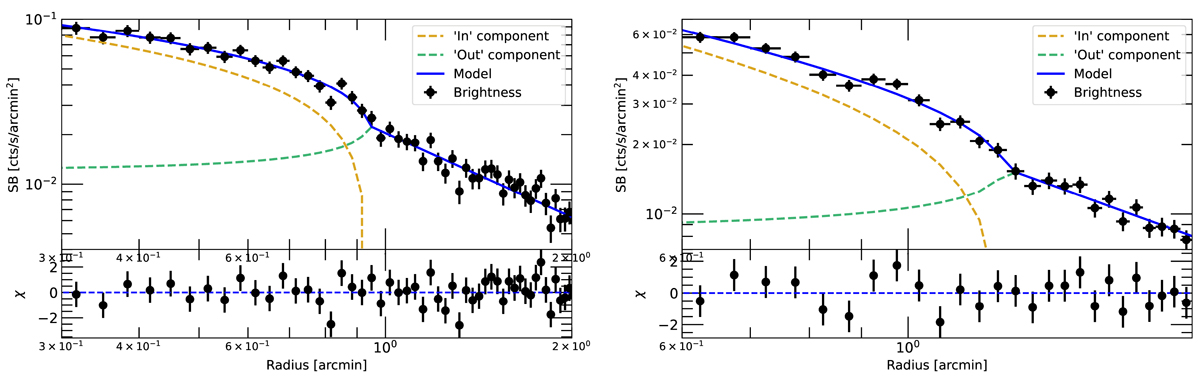
Fig. 8.
Download original image
Surface brightness profiles across the NW direction in a semicircle (from −57° to +123° from W and increasing counterclockwise, left panel) and in a narrower 80°-wide sector (from 0° to 80° from W and increasing counterclockwise, right panel). In each panel, the best-fit broken power-law model is overlaid in blue, while the residuals are shown in the lower boxes and the individual components of the SB associated with the broken power law inside (“In”) and outside (“Out”) the front are shown with dashed orange and green lines, respectively. As is discussed in the text, we interpret the inner edge (left panel, Rinner = 0.94′±0.02′∼295 ± 6 kpc) as a cold front and the outer edge (right panel, Router = 1.24′±0.02′∼389 ± 6 kpc) as a shock front. The radial distances are in units of arcmin, where 1 arcmin = 313.8 kpc.
Current usage metrics show cumulative count of Article Views (full-text article views including HTML views, PDF and ePub downloads, according to the available data) and Abstracts Views on Vision4Press platform.
Data correspond to usage on the plateform after 2015. The current usage metrics is available 48-96 hours after online publication and is updated daily on week days.
Initial download of the metrics may take a while.