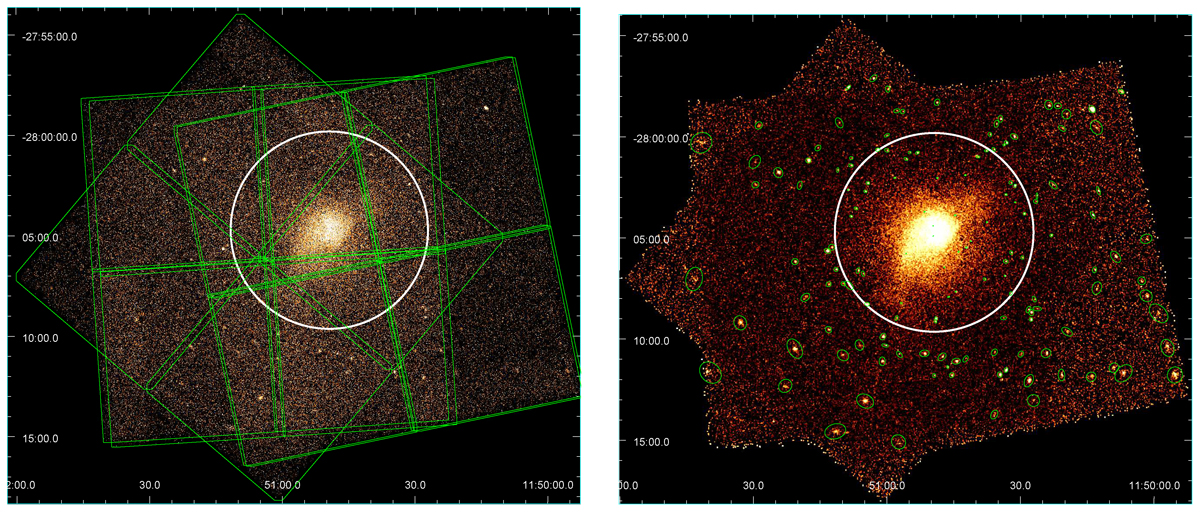
Fig. 1.
Download original image
Field of view of the Chandra observations of PLCKG287 (z = 0.383). Left panel: footprint of the five Chandra ObsIDs. Right panel: background-subtracted, exposure-corrected mosaic in the [0.5–7.0] keV band. The detected point sources that were removed from the analysis are shown with green ellipses. In both panels, the white circle indicates R500 = 1541 kpc, which is the region on which we focus our analysis.
Current usage metrics show cumulative count of Article Views (full-text article views including HTML views, PDF and ePub downloads, according to the available data) and Abstracts Views on Vision4Press platform.
Data correspond to usage on the plateform after 2015. The current usage metrics is available 48-96 hours after online publication and is updated daily on week days.
Initial download of the metrics may take a while.