Fig. 6.
Download original image
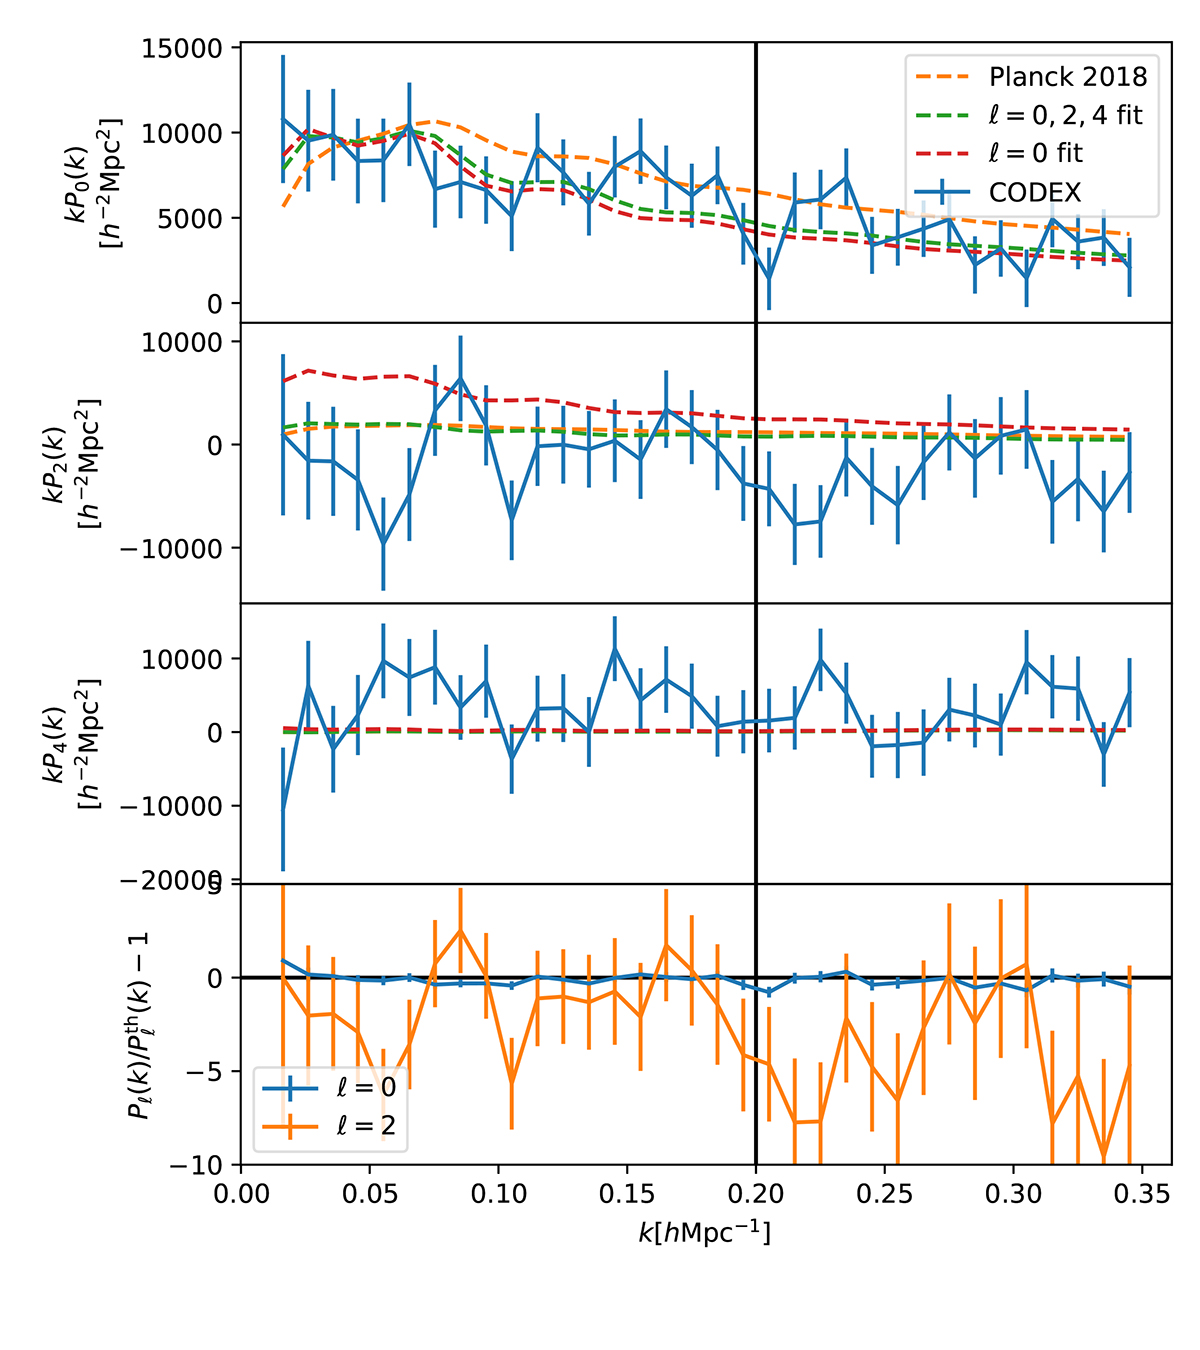
Multipoles of the CODEX cluster’s power spectrum. The solid lines with error bars show the measurements, and the dashed lines show the corresponding theoretical predictions. The orange lines show the theoretical prediction using the Planck 2018 cosmology, the green lines the prediction using the best-fit cosmology obtained using all the multipoles, and the red lines the prediction using the best-fit cosmology obtained using the monopole alone. Top panel: monopole (ℓ = 0). Second panel: Quadrupole (ℓ = 2) Third panel: hexadecapole (ℓ = 4). Bottom panel: relative difference of the measured and predicted spectra (Planck 2018 cosmology) for monopole and quadrupole. The predicted hexadecapole is close to zero, which makes the relative difference extremely large. The vertical black line shows up to which wavenumbers we include the measurements in our cosmological analysis.
Current usage metrics show cumulative count of Article Views (full-text article views including HTML views, PDF and ePub downloads, according to the available data) and Abstracts Views on Vision4Press platform.
Data correspond to usage on the plateform after 2015. The current usage metrics is available 48-96 hours after online publication and is updated daily on week days.
Initial download of the metrics may take a while.