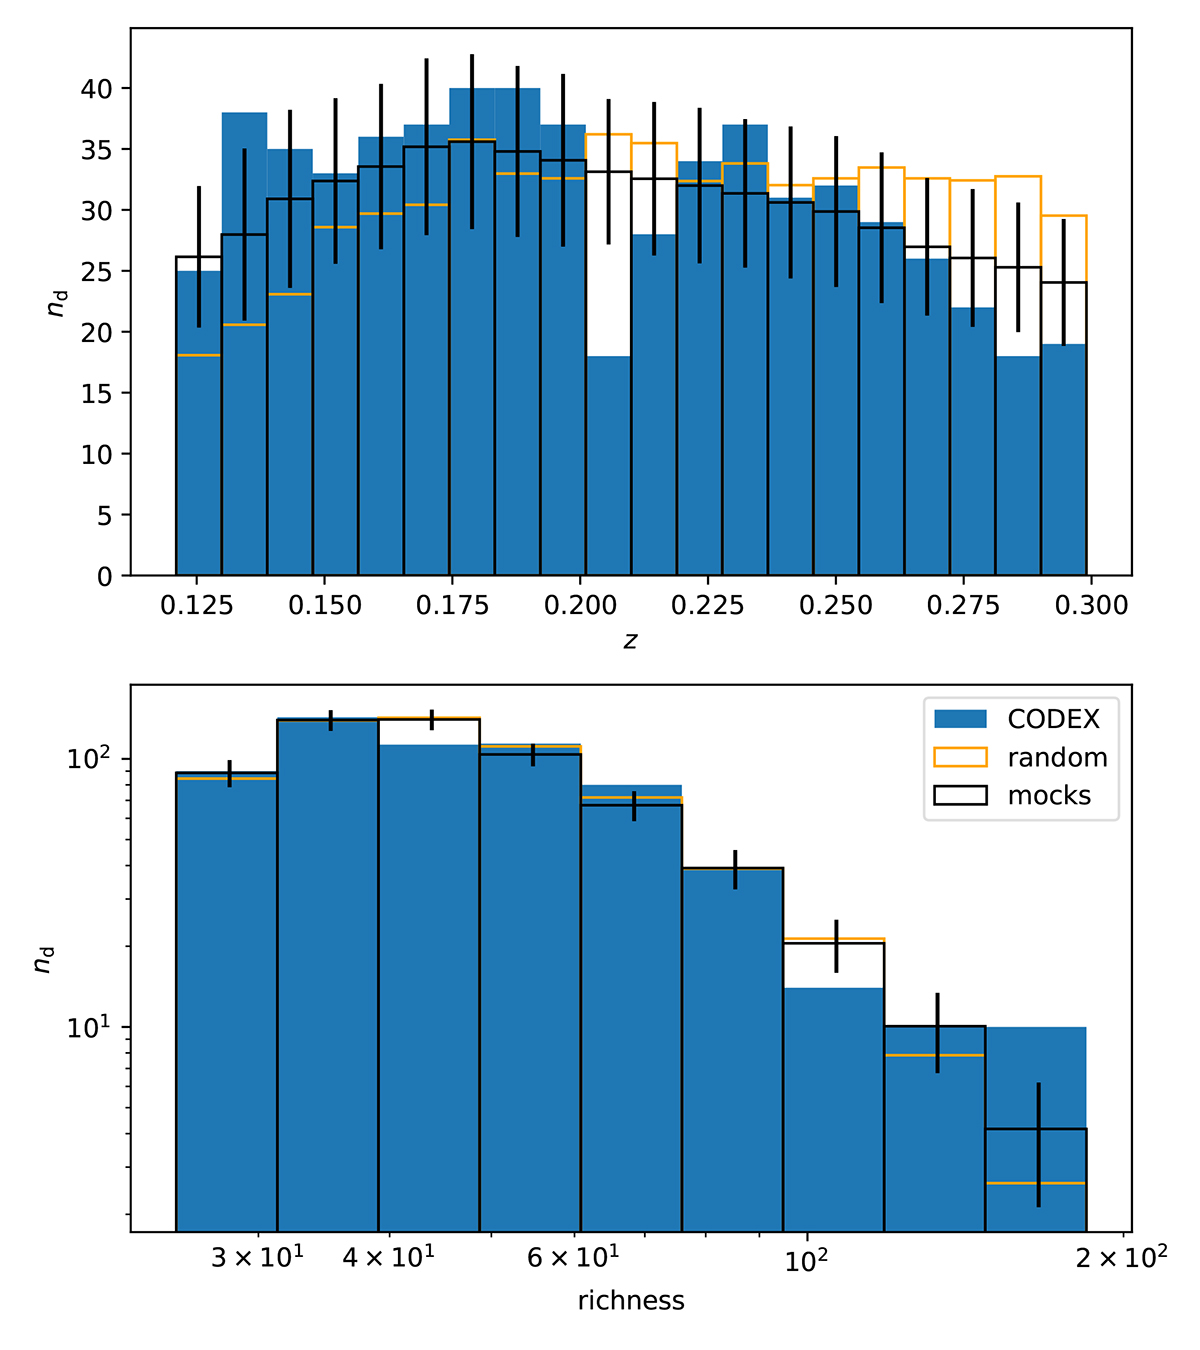
Fig. 2.
Download original image
One-point statistics of the random catalog and the mock catalogs compared to the corresponding CODEX quantities. The blue bars show the CODEX sample and the empty orange bars show the random sample. The bars that correspond to the random sample have been normalized with the ratio of objects in the CODEX and random samples. The empty black bars show the mean values over all the mock catalogs and the error bars show the standard deviation. Top panel: redshift. Bottom panel: richness.
Current usage metrics show cumulative count of Article Views (full-text article views including HTML views, PDF and ePub downloads, according to the available data) and Abstracts Views on Vision4Press platform.
Data correspond to usage on the plateform after 2015. The current usage metrics is available 48-96 hours after online publication and is updated daily on week days.
Initial download of the metrics may take a while.