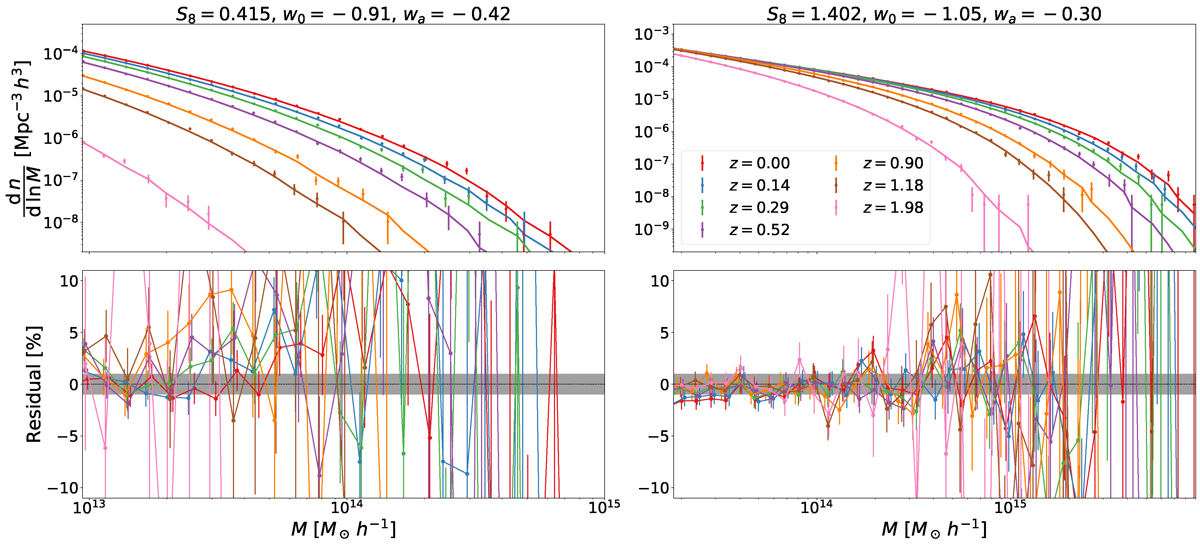
Fig. 7.
Download original image
Comparison between the HMF extracted from the two simulations with the lowest likelihood values (as shown in Fig. 6) and our model predictions. The left panel corresponds to the simulation with the lowest likelihood at redshift z = 0.52, and the right panel corresponds to the simulation with the lowest likelihood at z = 1.18. Different colors represent different redshifts. The simulation measurements are presented with Poisson error bars.
Current usage metrics show cumulative count of Article Views (full-text article views including HTML views, PDF and ePub downloads, according to the available data) and Abstracts Views on Vision4Press platform.
Data correspond to usage on the plateform after 2015. The current usage metrics is available 48-96 hours after online publication and is updated daily on week days.
Initial download of the metrics may take a while.