Open Access
Fig. 4.
Download original image
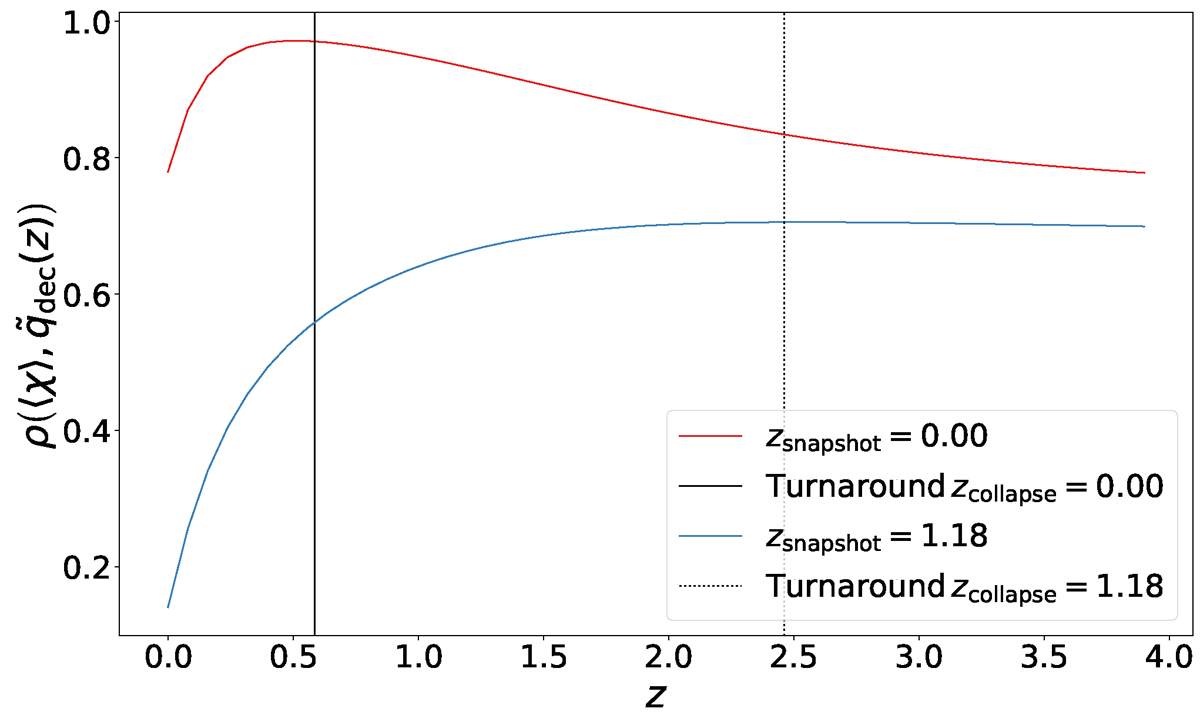
Correlation between the mean residual χ presented in the bottom panel of Fig. 3 with ![]() for two snapshots at redshifts z ∈ {0.00, 1.18}. We also present the spherical collapse prediction for the turnaround at the EdS universe for each redshift in solid (z = 0.00) and dotted (z = 1.18) black lines.
for two snapshots at redshifts z ∈ {0.00, 1.18}. We also present the spherical collapse prediction for the turnaround at the EdS universe for each redshift in solid (z = 0.00) and dotted (z = 1.18) black lines.
Current usage metrics show cumulative count of Article Views (full-text article views including HTML views, PDF and ePub downloads, according to the available data) and Abstracts Views on Vision4Press platform.
Data correspond to usage on the plateform after 2015. The current usage metrics is available 48-96 hours after online publication and is updated daily on week days.
Initial download of the metrics may take a while.