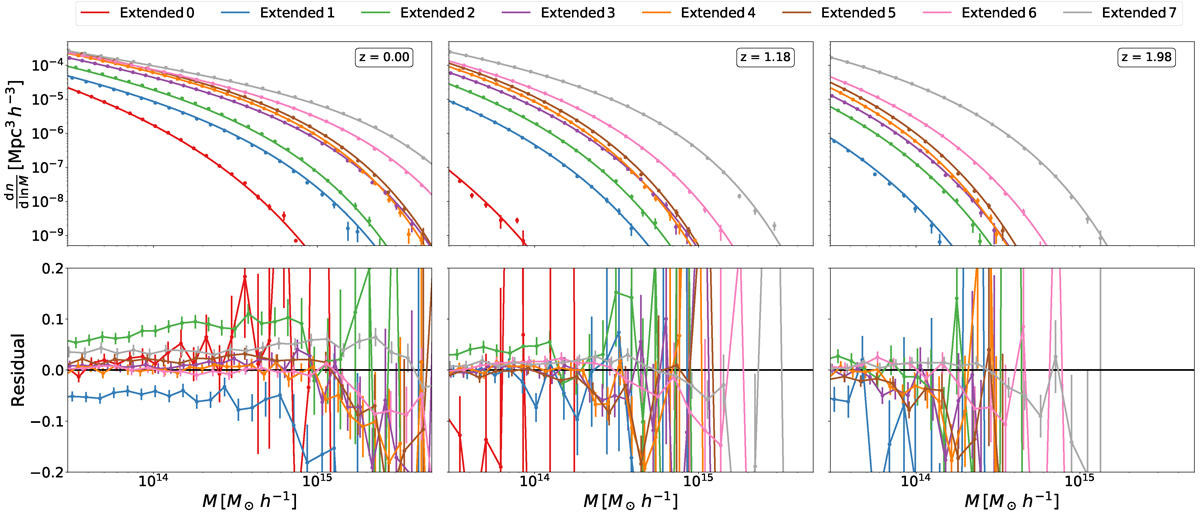
Fig. 3.
Download original image
Top: Comparison between the HMF predicted by the model of Euclid Collaboration: Castro et al. (2023) (curves) and the HMF measured for the extended large simulations (points). Error bars associated with each simulation point correspond to the Poisson uncertainty. Bottom: Relative difference between the model and the simulations. Different panels indicate different redshifts; from left to right, z = 0.00, 1.18, and 1.98.
Current usage metrics show cumulative count of Article Views (full-text article views including HTML views, PDF and ePub downloads, according to the available data) and Abstracts Views on Vision4Press platform.
Data correspond to usage on the plateform after 2015. The current usage metrics is available 48-96 hours after online publication and is updated daily on week days.
Initial download of the metrics may take a while.