Fig. 5
Download original image
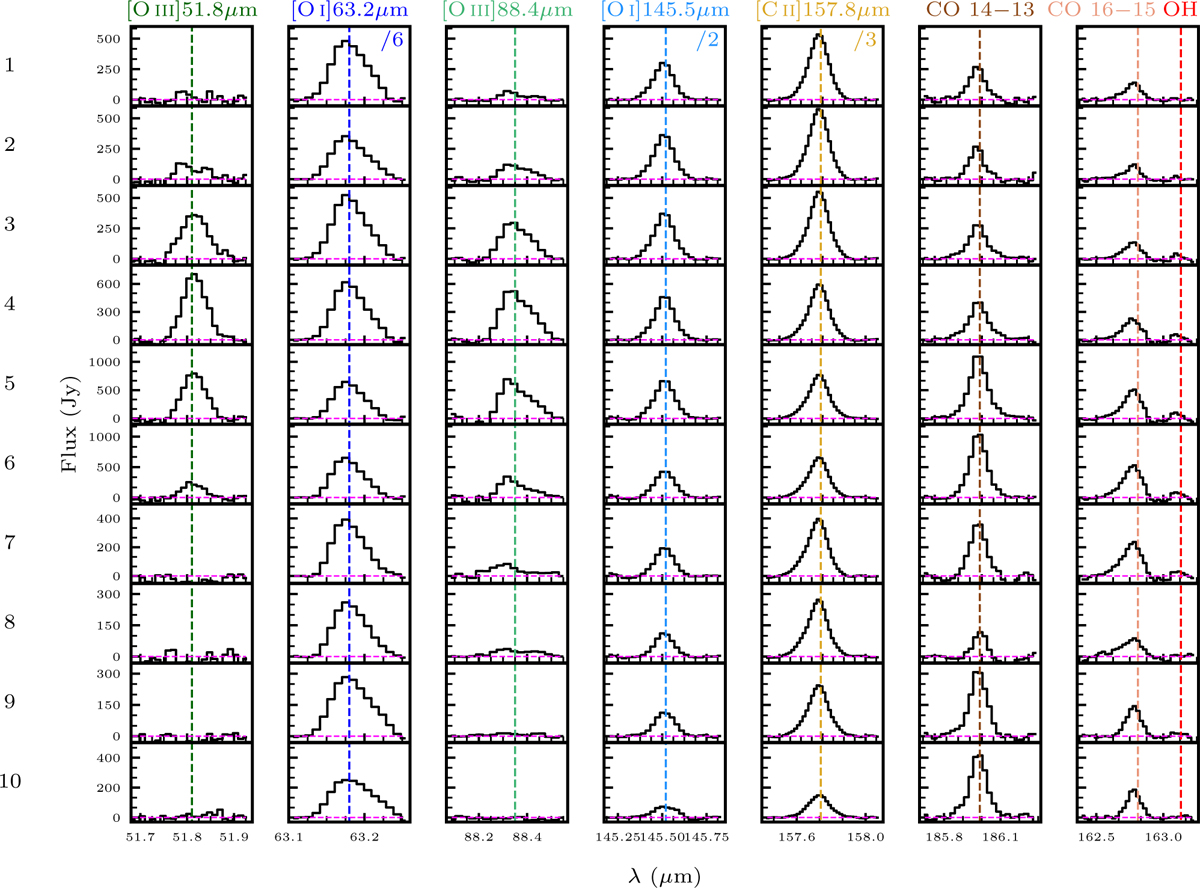
Continuum-subtracted FIFI-LS spectra of far-IR emission lines detected toward DR21 Main (see Table 2). Each row corresponds to the emission integrated in the boxes of 16.5′′ × 50′′ each along the DR21 Main outflow, with position numbers increasing from east to west (see Figs. C.1 and 2). The spectra of [O I] 63.18 μm, [O I] 145.53 μm, and [C II] 157.74 μm are divided by factors of 6, 2, and 3, respectively.
Current usage metrics show cumulative count of Article Views (full-text article views including HTML views, PDF and ePub downloads, according to the available data) and Abstracts Views on Vision4Press platform.
Data correspond to usage on the plateform after 2015. The current usage metrics is available 48-96 hours after online publication and is updated daily on week days.
Initial download of the metrics may take a while.