Fig. 4
Download original image
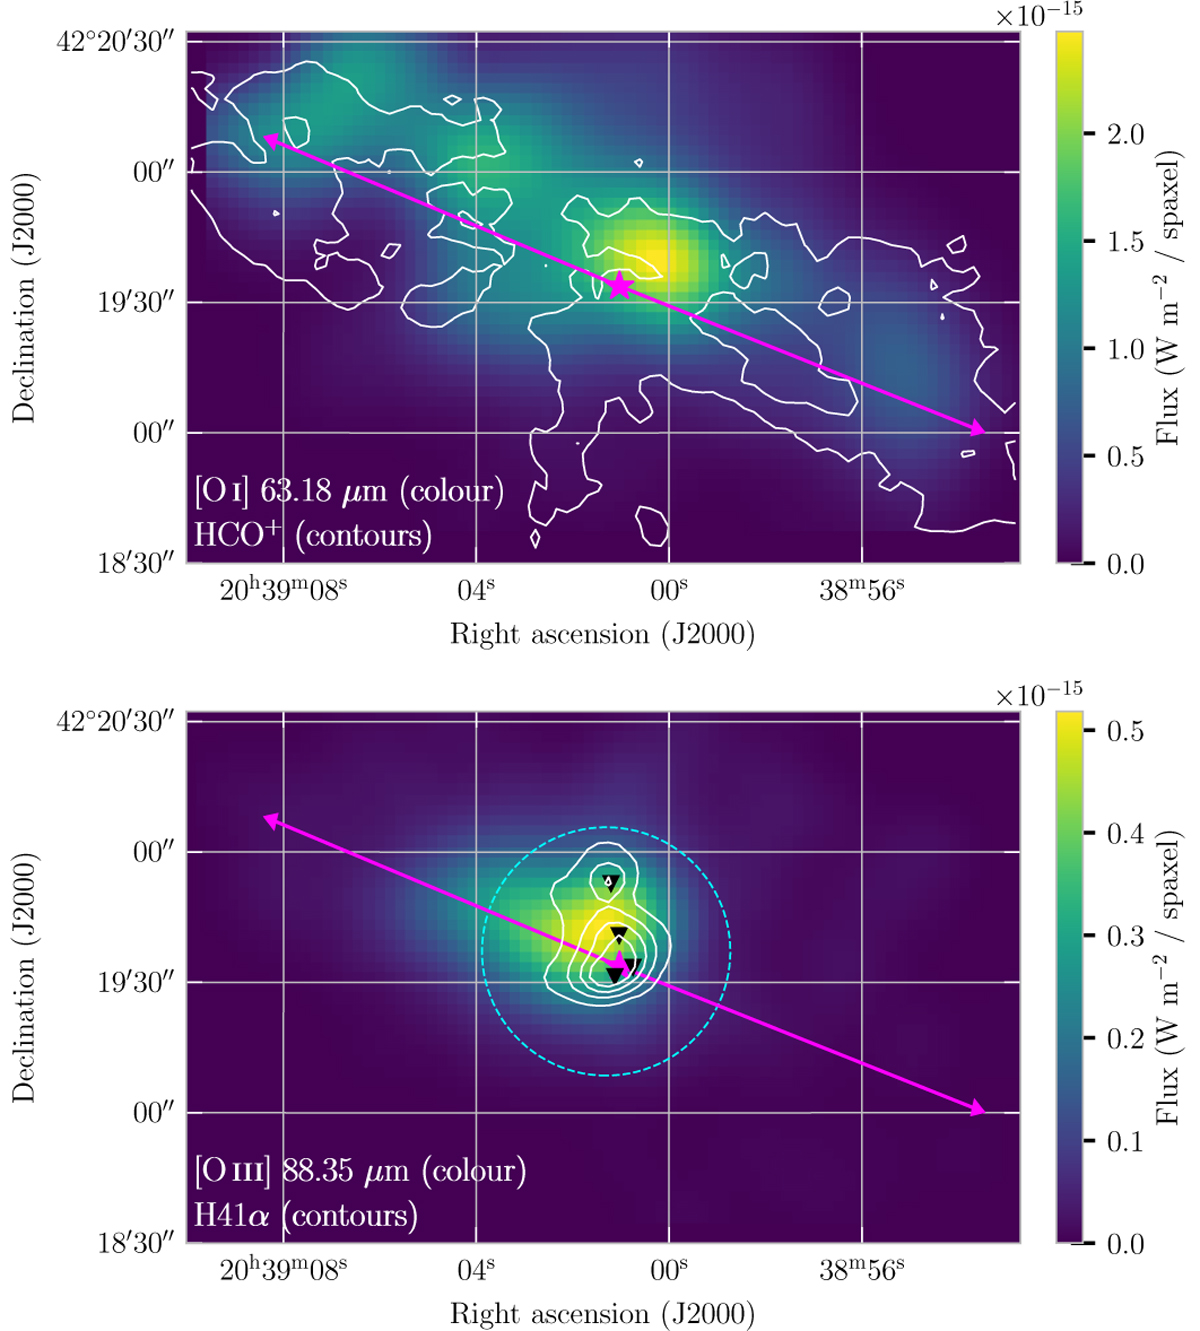
Integrated intensity maps of the [O I] line at 63.18 μm with HCO+ 1–0 in solid contours at 5σ (upper panel), and the [O III] line at 88.35 μm with H 41 α in solid contours with steps of 5σ, 20σ, 40σ, 60σ (lower panel). The cyan dashed circle represents the H II region identified in the Global view on Star formation in the Milky Way (GLOSTAR; Brunthaler et al. 2021) survey (Khan et al. 2024), and the black downward triangles show the cometary sources observed for the first time by Harris (1973).
Current usage metrics show cumulative count of Article Views (full-text article views including HTML views, PDF and ePub downloads, according to the available data) and Abstracts Views on Vision4Press platform.
Data correspond to usage on the plateform after 2015. The current usage metrics is available 48-96 hours after online publication and is updated daily on week days.
Initial download of the metrics may take a while.