Fig. A.5
Download original image
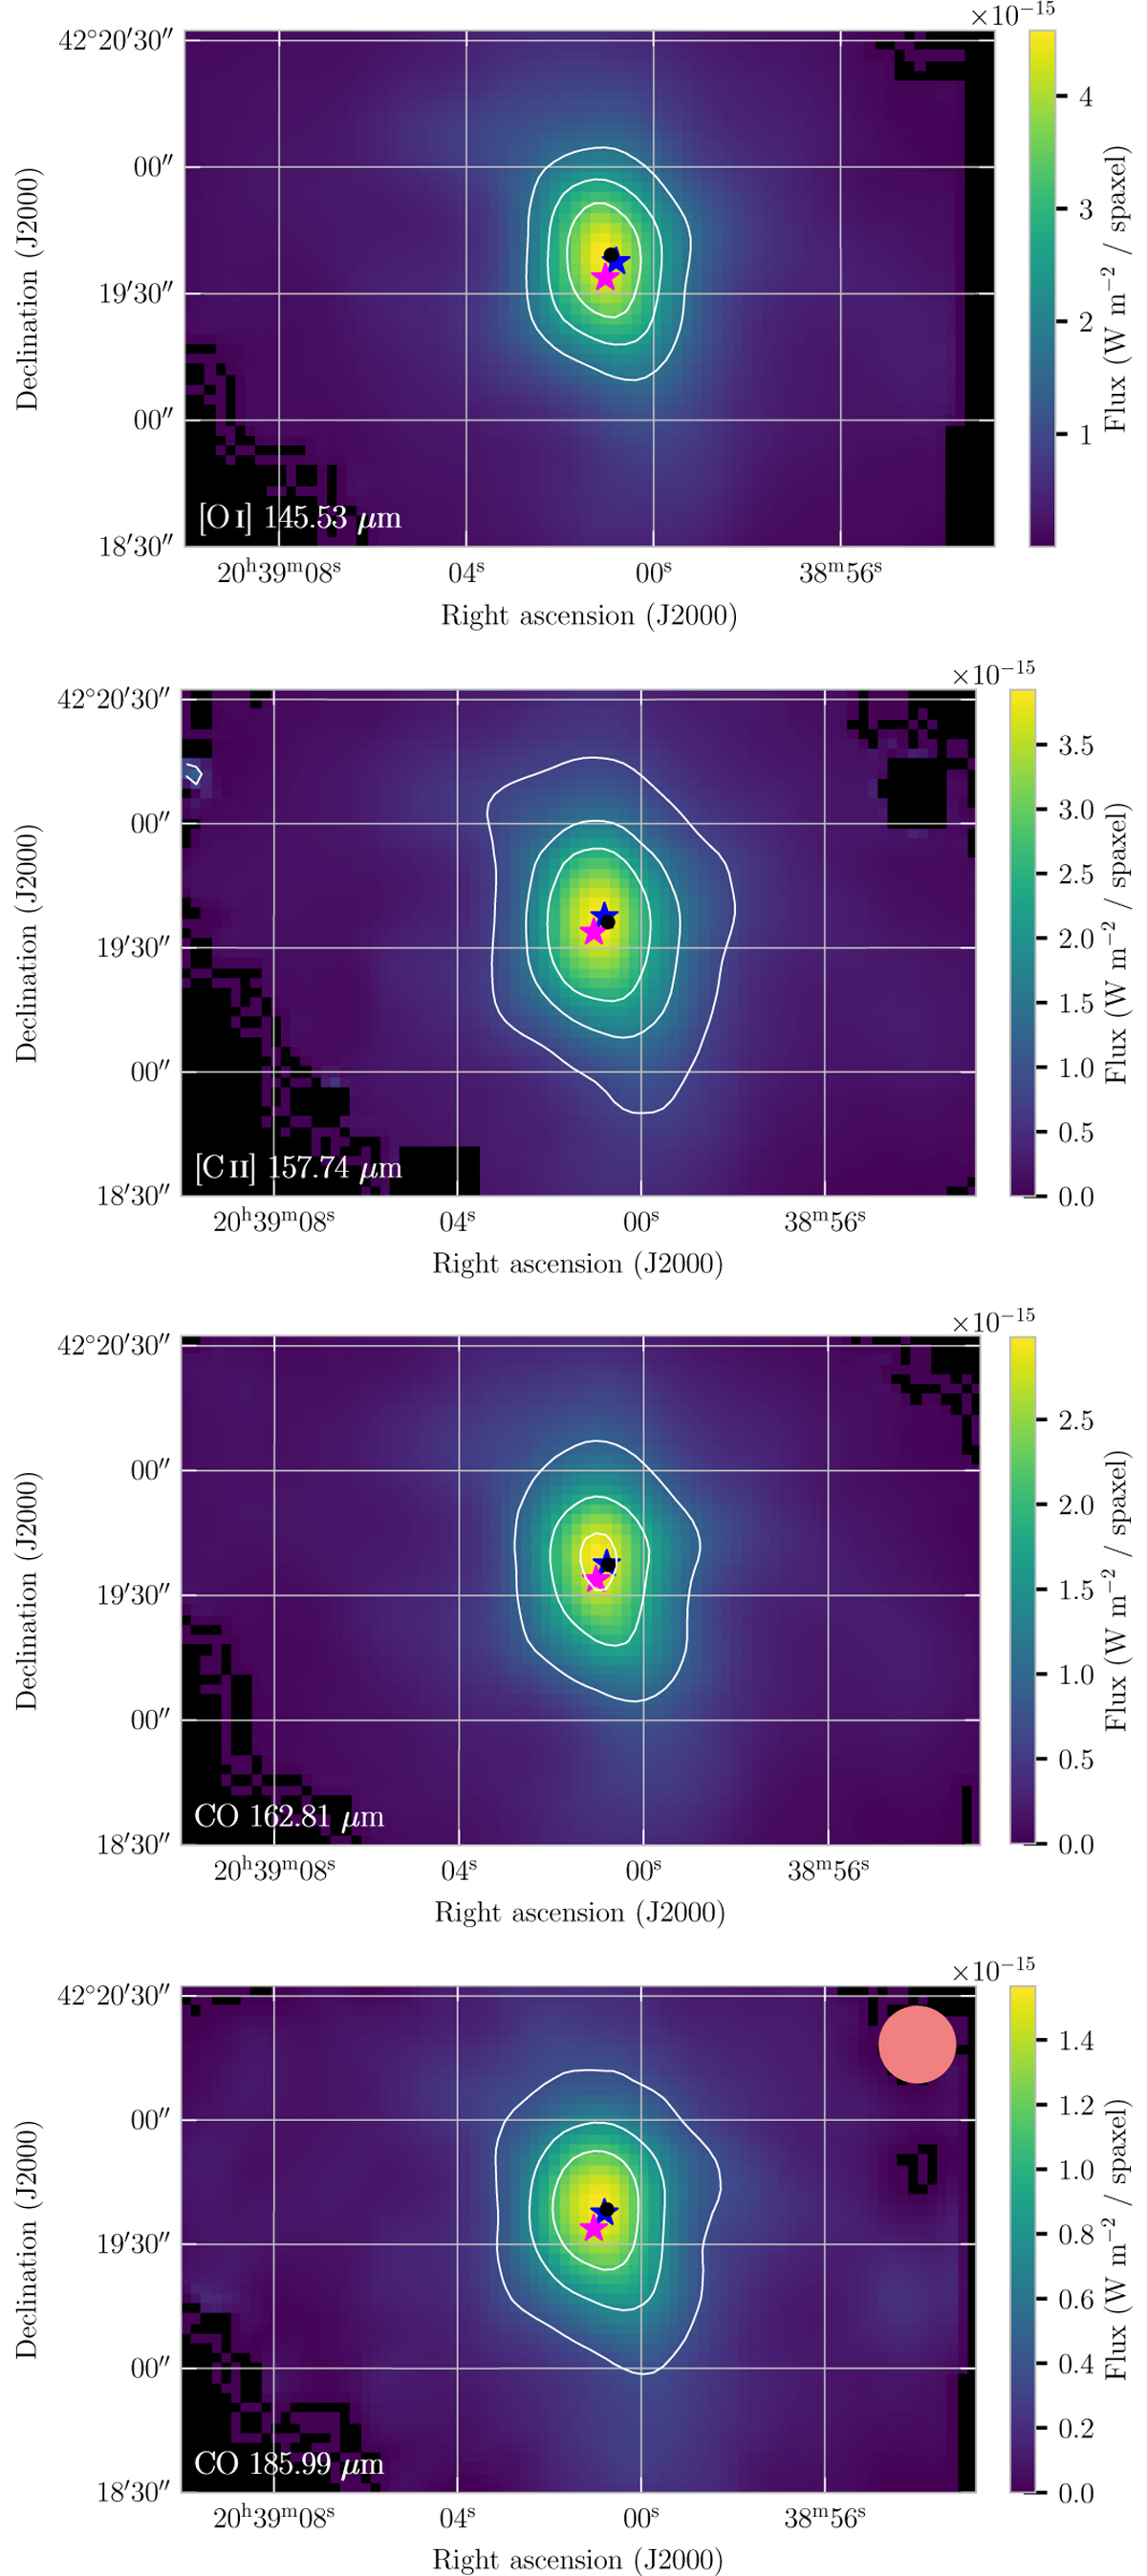
Continuum emission from FIFI-LS at wavelengths above 100 μm. The maps show (from top to bottom) the distribution of continuum emission with contours in the vicinity of the [O I] line at 145.53 μm (10, 15, 20σ), the [C II] line at 157.74 μm (6, 12, 18σ), and the CO 16–15 and 14–13 lines at 162.81 (10, 20, and 30σ) and 185.99 μm (5, 10, and 15σ). The beam size is shown for the CO 14–13 line at 185.99 μm.
Current usage metrics show cumulative count of Article Views (full-text article views including HTML views, PDF and ePub downloads, according to the available data) and Abstracts Views on Vision4Press platform.
Data correspond to usage on the plateform after 2015. The current usage metrics is available 48-96 hours after online publication and is updated daily on week days.
Initial download of the metrics may take a while.