Fig. A.4
Download original image
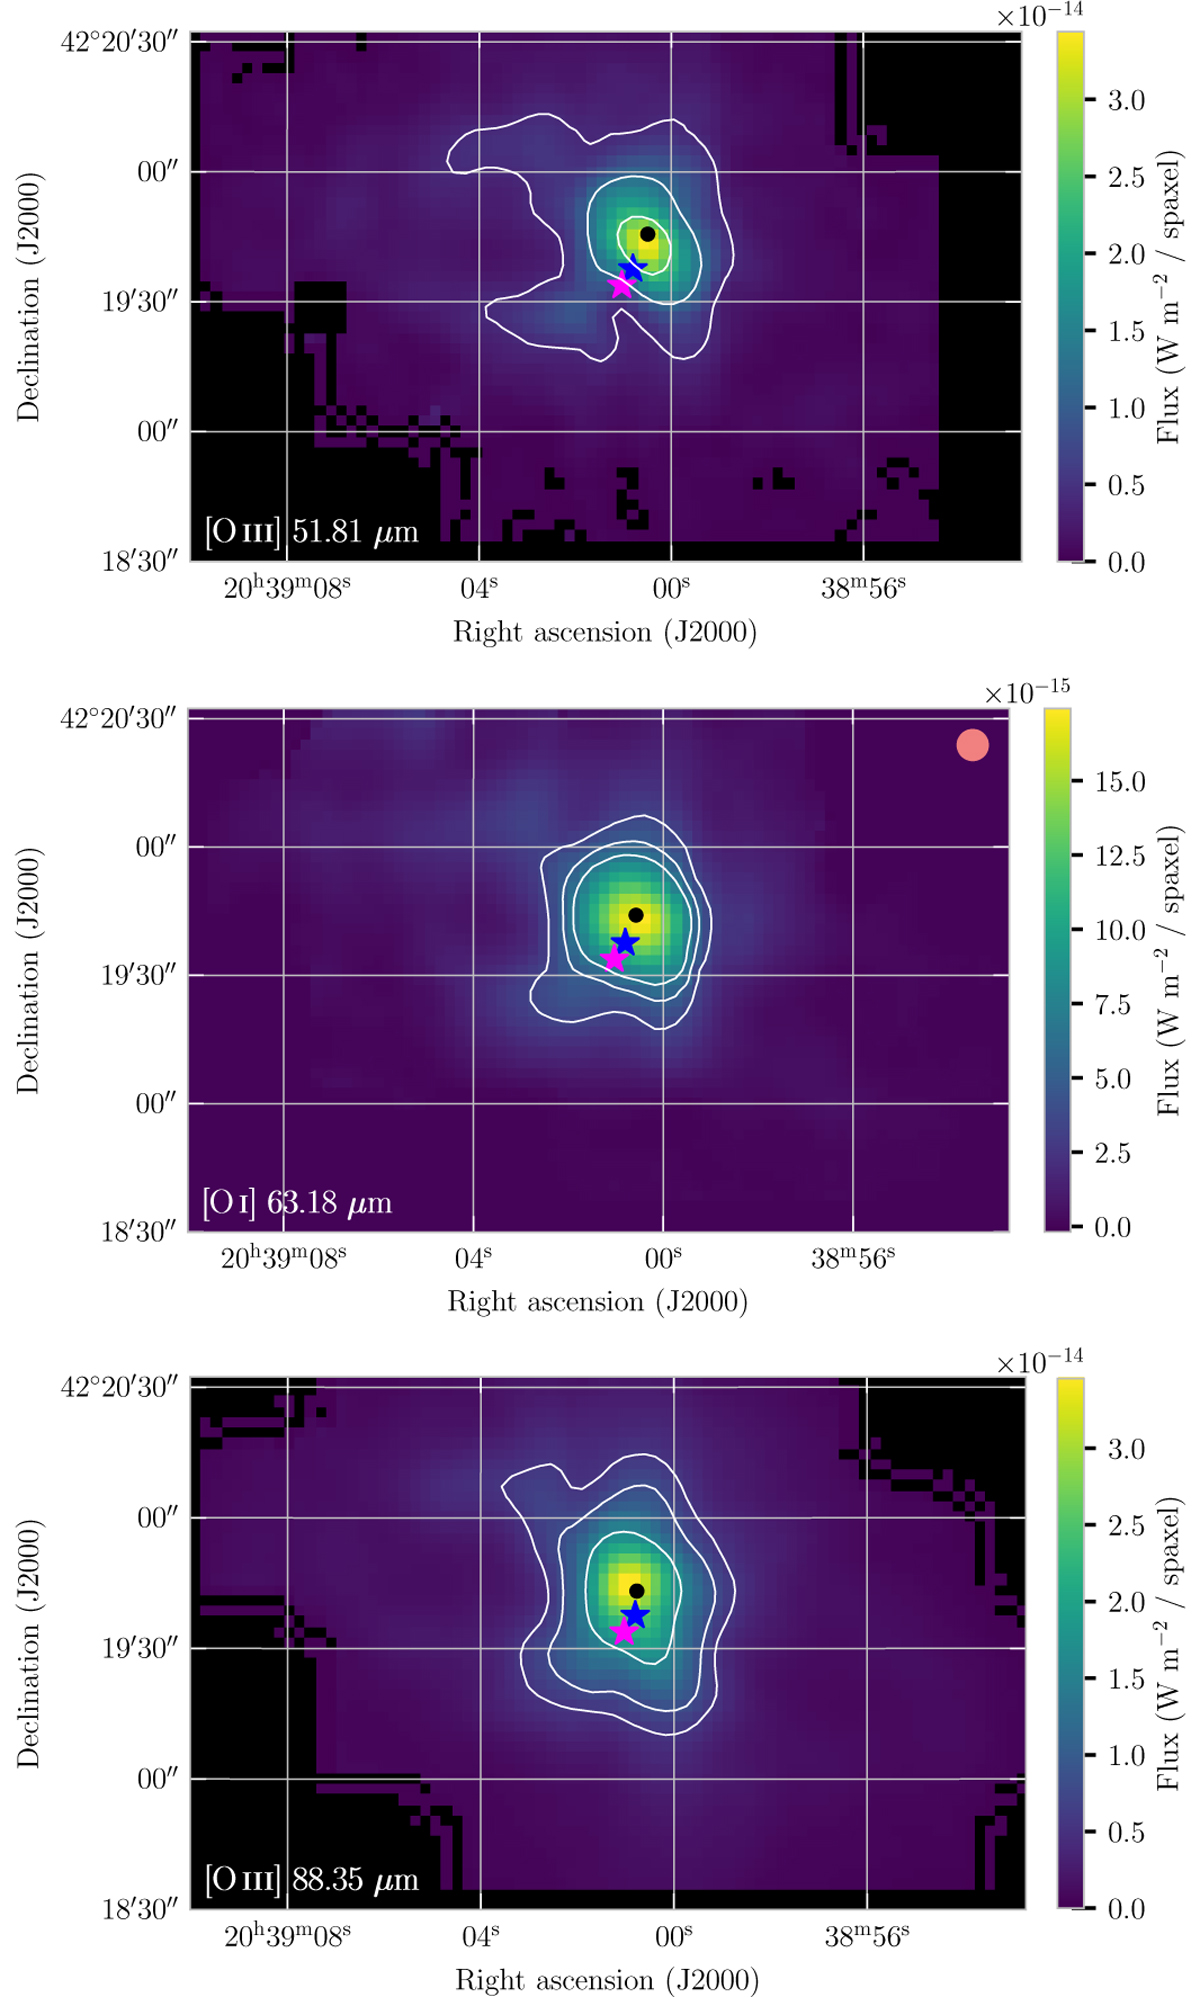
Continuum emission from FIFI-LS at wavelengths below 100 μm. The maps show (from top to bottom) the distribution of continuum emission with contours in the vicinity of the [O III] line at 51.81 μm (5, 15, and 30σ), the [O I] line at 63.18 μm (10, 15, and 20σ), and the [O III] line at 88.35 μm (10, 15, and 30σ). The magenta and blue stars show the center of DR21-1 core (Cao et al. 2019) and the center of the explosive outflow (Guzmán Ccolque et al. 2024). The black dot indicates the continuum center from 2D Gaussian fitting (see Table A.2), and the beam size is shown for the [O I] line at 63.18 μm as an orange circle.
Current usage metrics show cumulative count of Article Views (full-text article views including HTML views, PDF and ePub downloads, according to the available data) and Abstracts Views on Vision4Press platform.
Data correspond to usage on the plateform after 2015. The current usage metrics is available 48-96 hours after online publication and is updated daily on week days.
Initial download of the metrics may take a while.