Fig. 2
Download original image
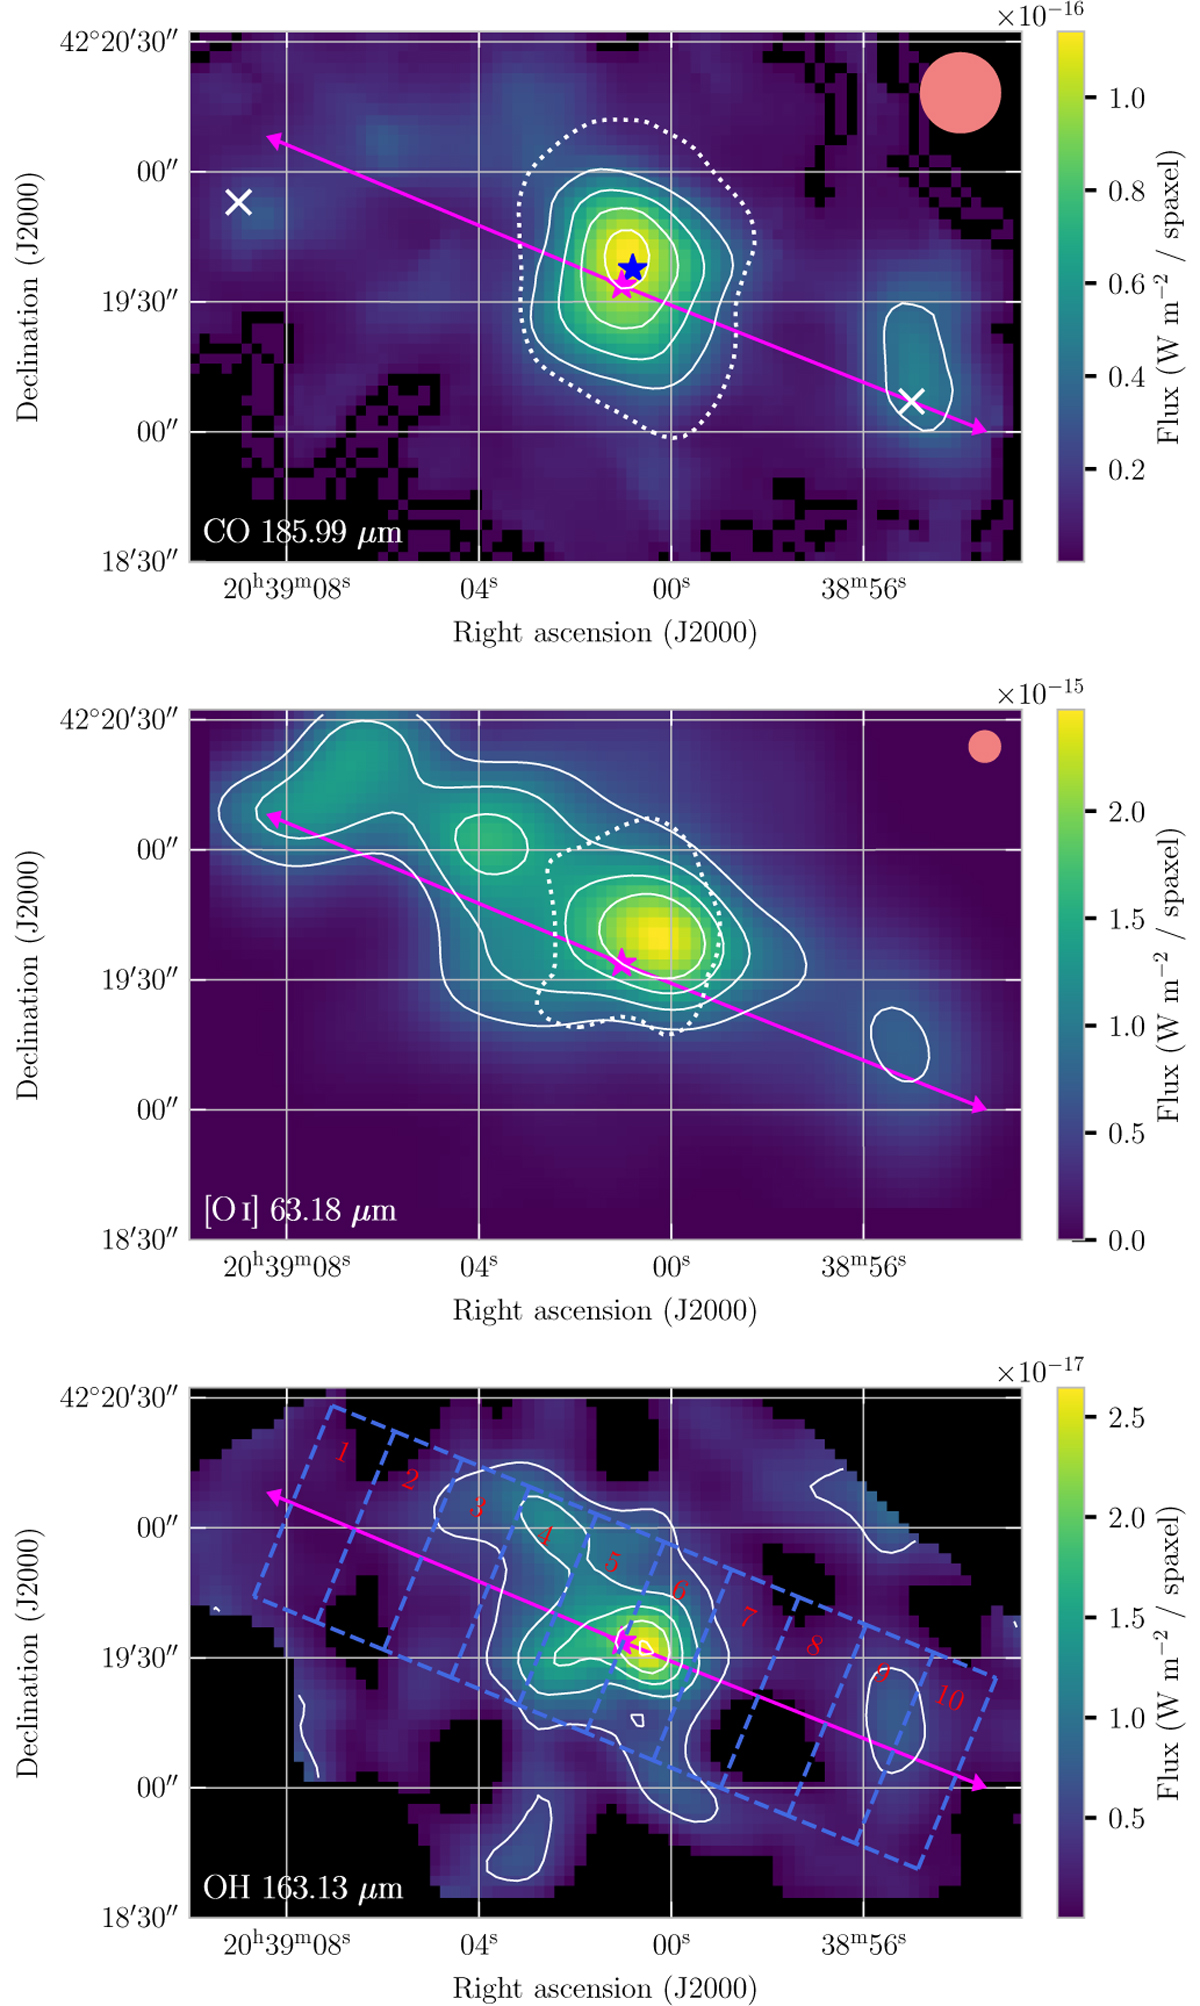
Integrated intensity maps of the CO 14–13 line at 185.99 μm (top panel), the [O I] line at 63.18 μm (middle panel), and the OH line at 163.13 μm (bottom panel). The solid contours show the line emission in steps of 5σ, 8σ, 11σ, 14σ, 15σ (top panel); 35σ, 55σ, 75σ, 95σ (middle panel); and 5σ, 10σ, 15σ, 20σ, 25σ (bottom panel). The dotted contours show the extent of the continuum emission at the 5σ level. The magenta and blue stars show the DR21-1 core (Cao et al. 2019) and the center of the explosive outflow at (α, δ)J 2000=(20h 39m 00s.8,+42∘ 19′ 37′′.62) from Guzmán Ccolque et al. (2024); the magenta arrows indicate the outflow direction from HCO+ (Skretas et al. 2023) and the white crosses (×) the H2 peaks (Garden et al. 1986). The maps were convolved with the beam size at 186 μm, represented by the orange circle at the map. For comparison, the original beam size at 63 μm is also shown. The blue dashed grid lines show the area of ten boxes used for the analysis of the far-IR emission along the outflow direction (see Sect. 3).
Current usage metrics show cumulative count of Article Views (full-text article views including HTML views, PDF and ePub downloads, according to the available data) and Abstracts Views on Vision4Press platform.
Data correspond to usage on the plateform after 2015. The current usage metrics is available 48-96 hours after online publication and is updated daily on week days.
Initial download of the metrics may take a while.