Fig. A.1
Download original image
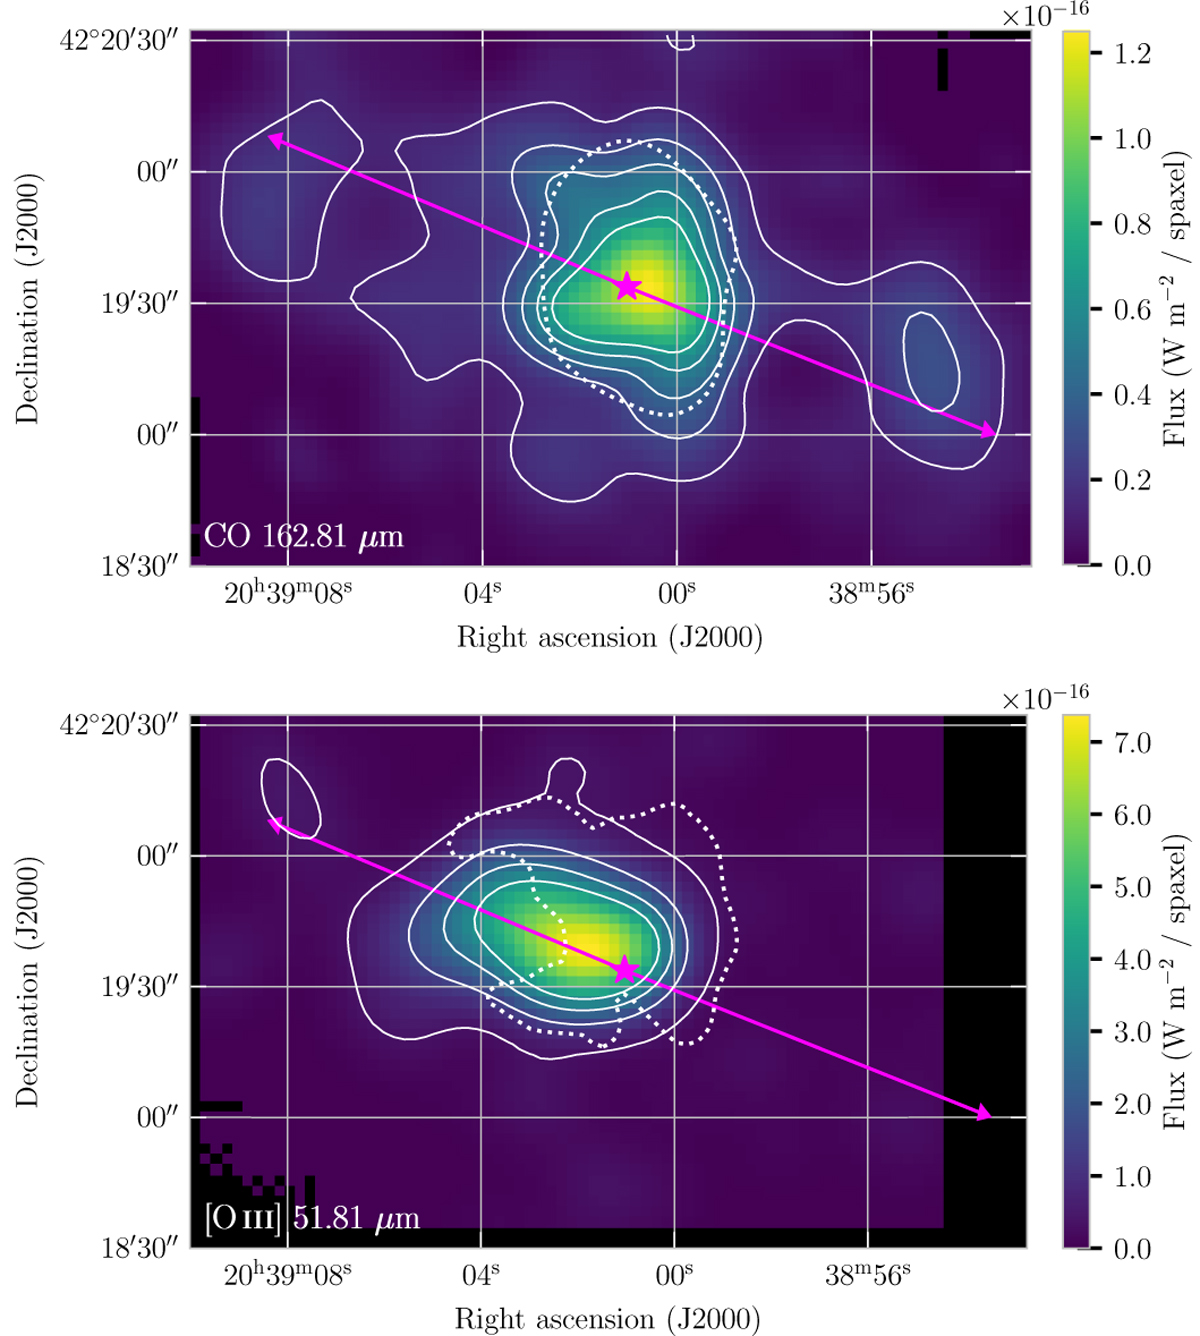
Integrated intensity maps of the CO 16–15 line at 162.81 μm (top) and the [O III] line at 51.81 μm (bottom). Solid contours show the line emission in steps of 5σ, 10σ, 15σ, 20σ, 25σ (top) and 5σ, 20σ, 35σ, 50σ (bottom). Dotted contours show the extent of the continuum emission in the close vicinity of the targeted lines at the 5σ level. See also Figs. 2 and 3.
Current usage metrics show cumulative count of Article Views (full-text article views including HTML views, PDF and ePub downloads, according to the available data) and Abstracts Views on Vision4Press platform.
Data correspond to usage on the plateform after 2015. The current usage metrics is available 48-96 hours after online publication and is updated daily on week days.
Initial download of the metrics may take a while.