Fig. 16
Download original image
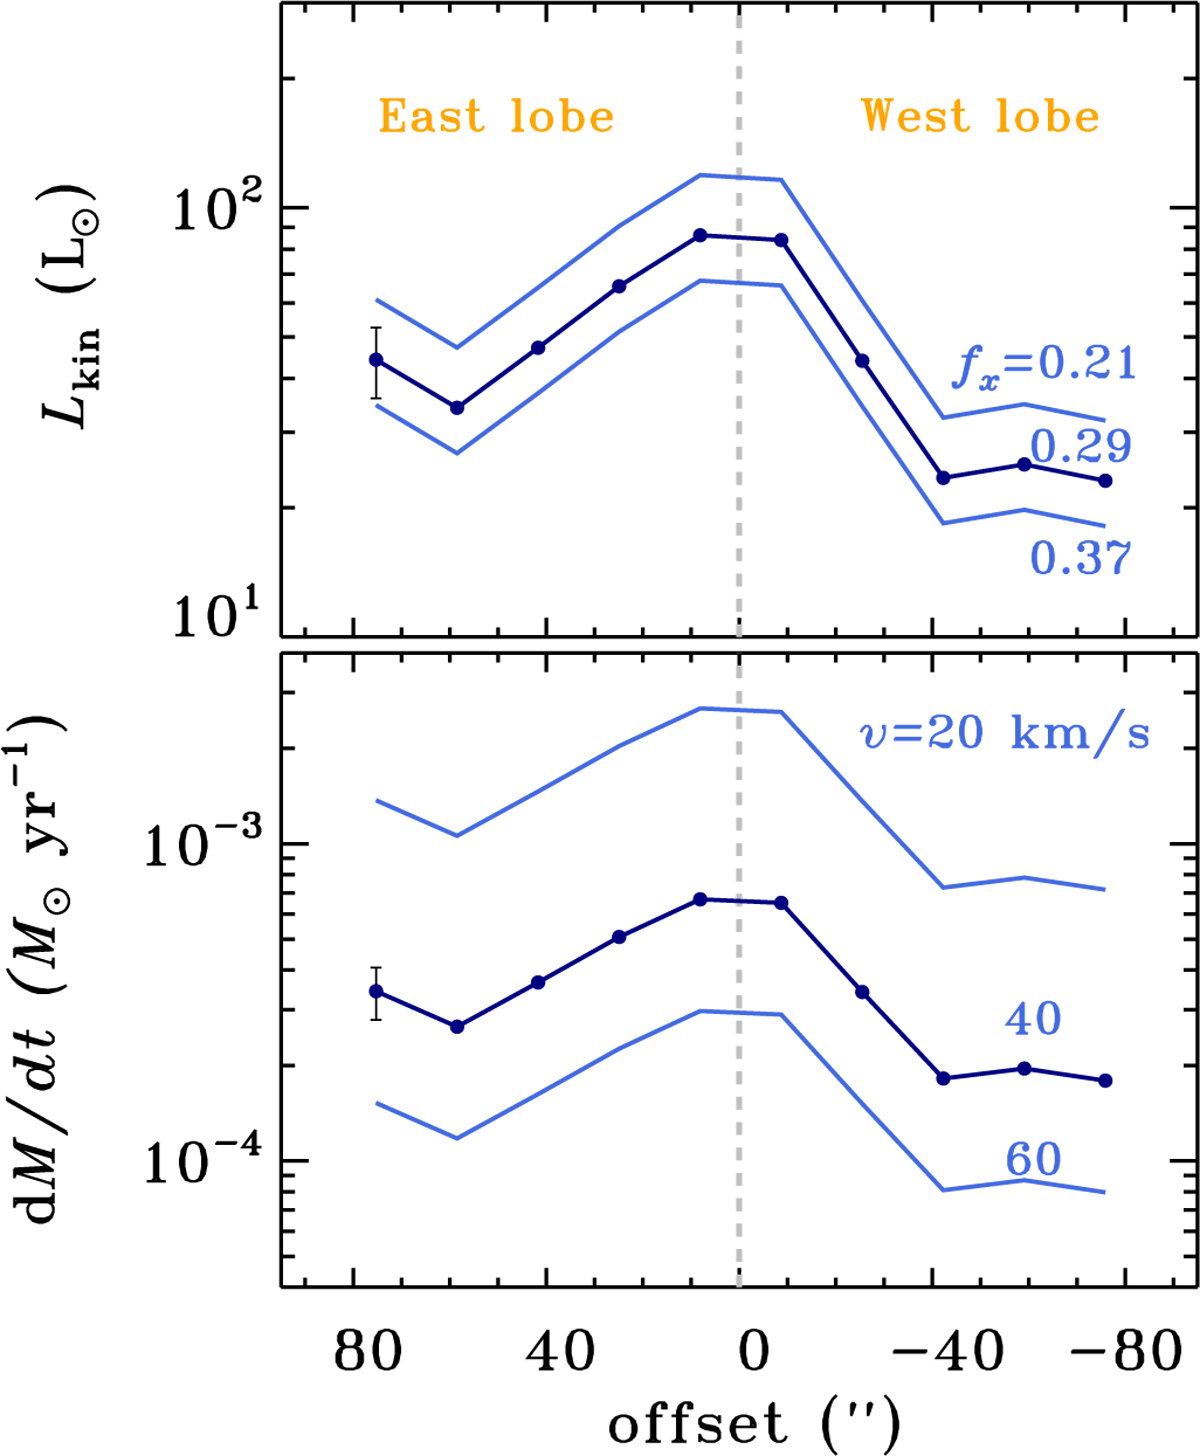
Outflow power (top) and mass outflow rates (bottom) along the DR21 Main outflow. The vertical navy blue line shows a typical errorbar for observations assuming 20% calibration error (see Table 6). The light blue lines show a range of outflow power assuming a fraction of cooling, fx, of 0.21 and 0.37 (top), and a range of mass loss rates assuming various shock velocities, v, of 20 and 60 km s−1 (bottom).
Current usage metrics show cumulative count of Article Views (full-text article views including HTML views, PDF and ePub downloads, according to the available data) and Abstracts Views on Vision4Press platform.
Data correspond to usage on the plateform after 2015. The current usage metrics is available 48-96 hours after online publication and is updated daily on week days.
Initial download of the metrics may take a while.