Fig. 14
Download original image
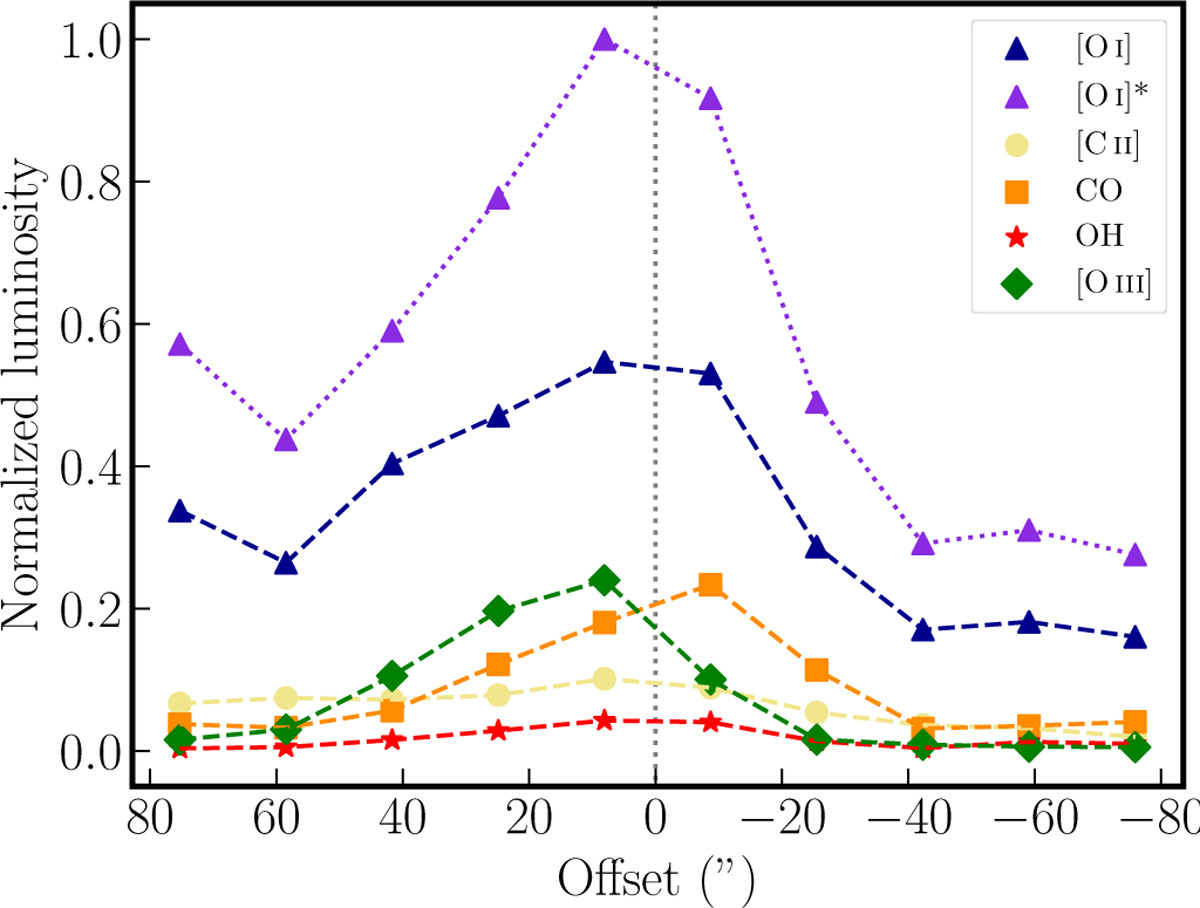
Line luminosities of far-IR lines along the DR21 Main outflow. The absorption-corrected luminosity of [O I] is shown in violet and the measured values from FIFI-LS in blue. The total line luminosities of [C II], CO, OH, and [O III] are in yellow, orange, red, and green, respectively. They are normalized to the total luminosity of absorption-corrected [O I] luminosity – [O I]*. In addition, OH is scaled up by a factor of 5 for better visualization. The X-axis shows the offset from the adopted center of DR21 Main; see also Fig. 7.
Current usage metrics show cumulative count of Article Views (full-text article views including HTML views, PDF and ePub downloads, according to the available data) and Abstracts Views on Vision4Press platform.
Data correspond to usage on the plateform after 2015. The current usage metrics is available 48-96 hours after online publication and is updated daily on week days.
Initial download of the metrics may take a while.