Fig. 13
Download original image
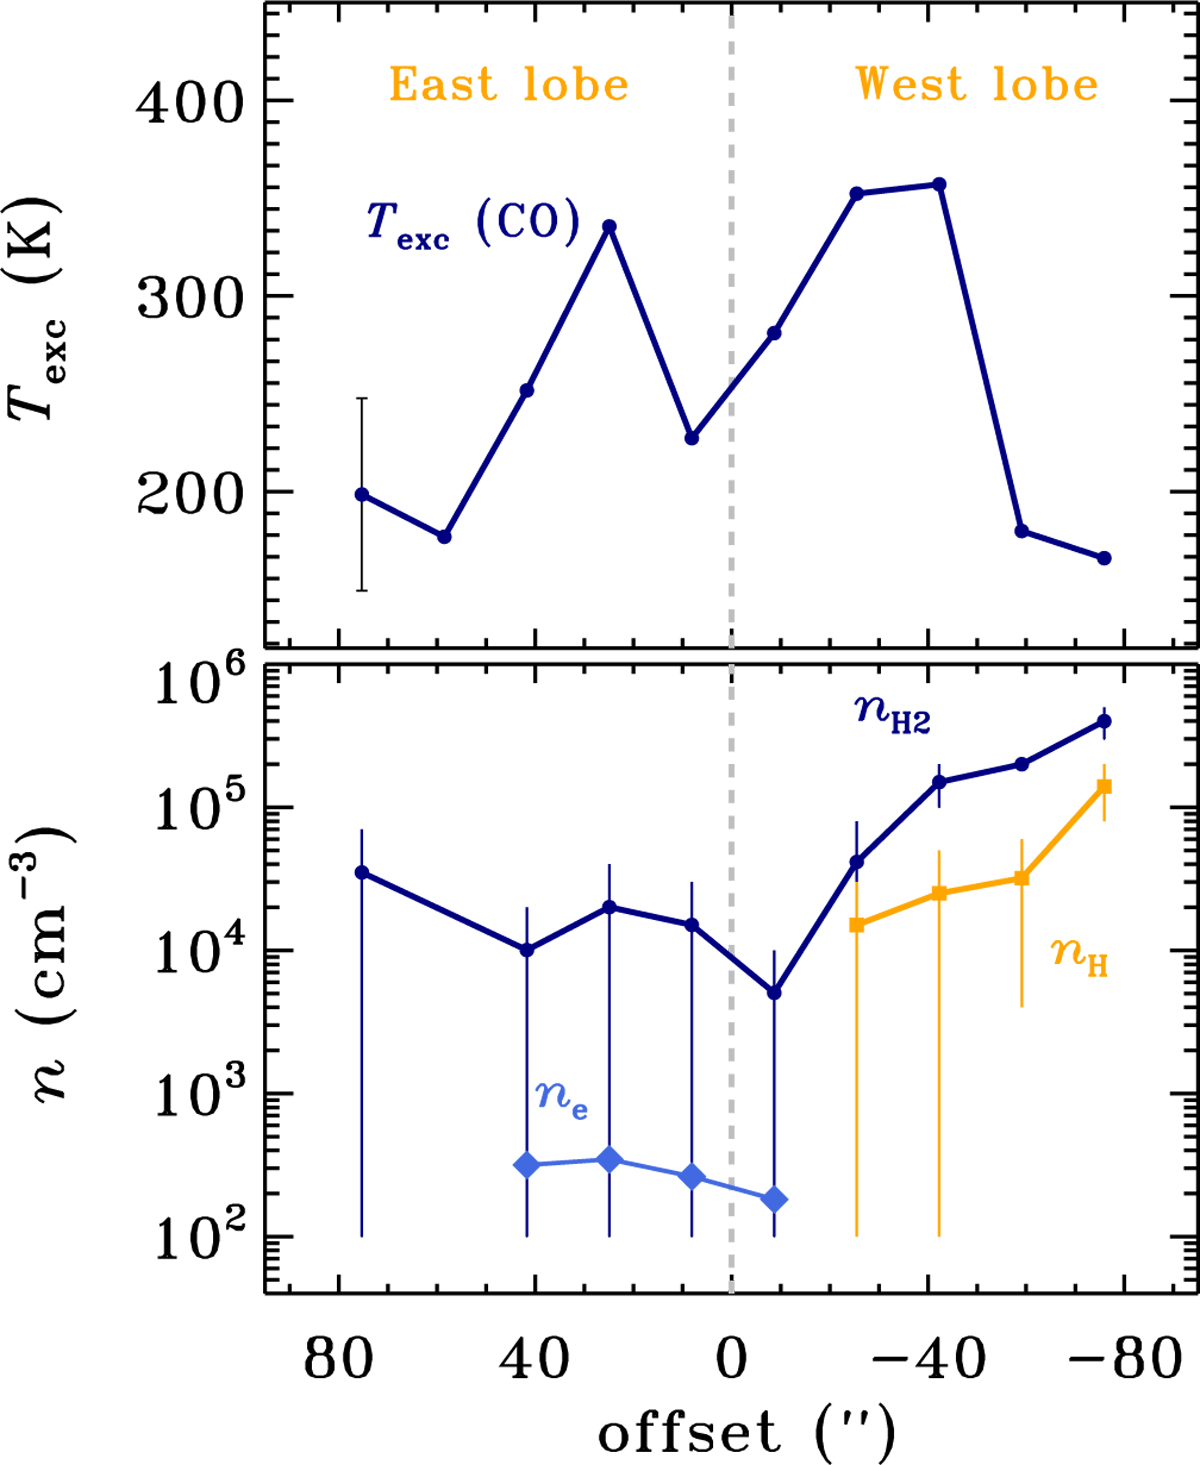
Physical conditions along the DR21 Main outflow: CO excitation temperature (top) and gas densities (bottom). The CO excitation temperature is obtained from the ratio of CO 14–13 and 16–15 lines at 185.99 μm and 162.81 μm, respectively (see Sect. 4.2.1). A typical errorbar is shown for the offset of 80′′. The H2, H, and e densities are estimated assuming the oxygen column density of 1017 cm−2, in regions where sufficient agreement with observations was found (Sect. 4.2.2). The gas temperature of 300 K, consistent with Trot(CO), was further assumed for the H2 and H emitting gas. The vertical lines show the ranges of densities in agreement with models, whereas the symbols refer to the average values at a given offset.
Current usage metrics show cumulative count of Article Views (full-text article views including HTML views, PDF and ePub downloads, according to the available data) and Abstracts Views on Vision4Press platform.
Data correspond to usage on the plateform after 2015. The current usage metrics is available 48-96 hours after online publication and is updated daily on week days.
Initial download of the metrics may take a while.