Fig. 11
Download original image
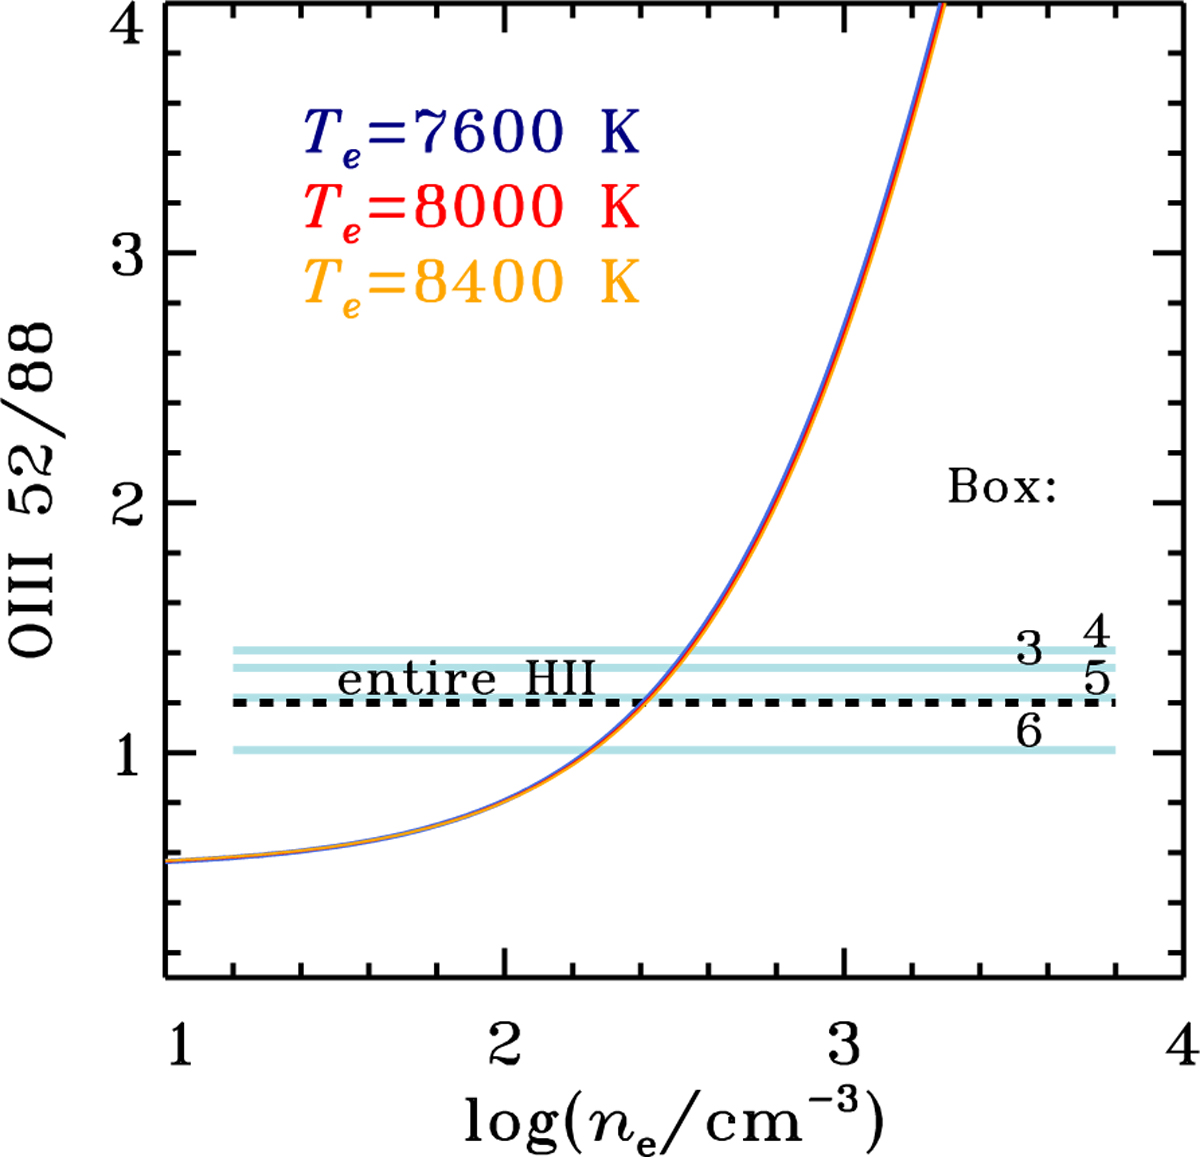
Ratio of line fluxes of [O III] lines at 52 and 88 μm in units of erg cm−2 s−1 as a function of logarithm of electron density. The lines show non-LTE radiative-transfer models for a gas electron temperature of 8000 ± 400 K derived from the GLOSTAR survey (Khan et al. 2024). The observed ratios toward boxes 3–6 along the DR21 outflow, where both [O III] lines are firmly detected, are shown as light blue lines, and for the area of the H II region in GLOSTAR (see Fig. 4) as dashed black line.
Current usage metrics show cumulative count of Article Views (full-text article views including HTML views, PDF and ePub downloads, according to the available data) and Abstracts Views on Vision4Press platform.
Data correspond to usage on the plateform after 2015. The current usage metrics is available 48-96 hours after online publication and is updated daily on week days.
Initial download of the metrics may take a while.