Fig. 1
Download original image
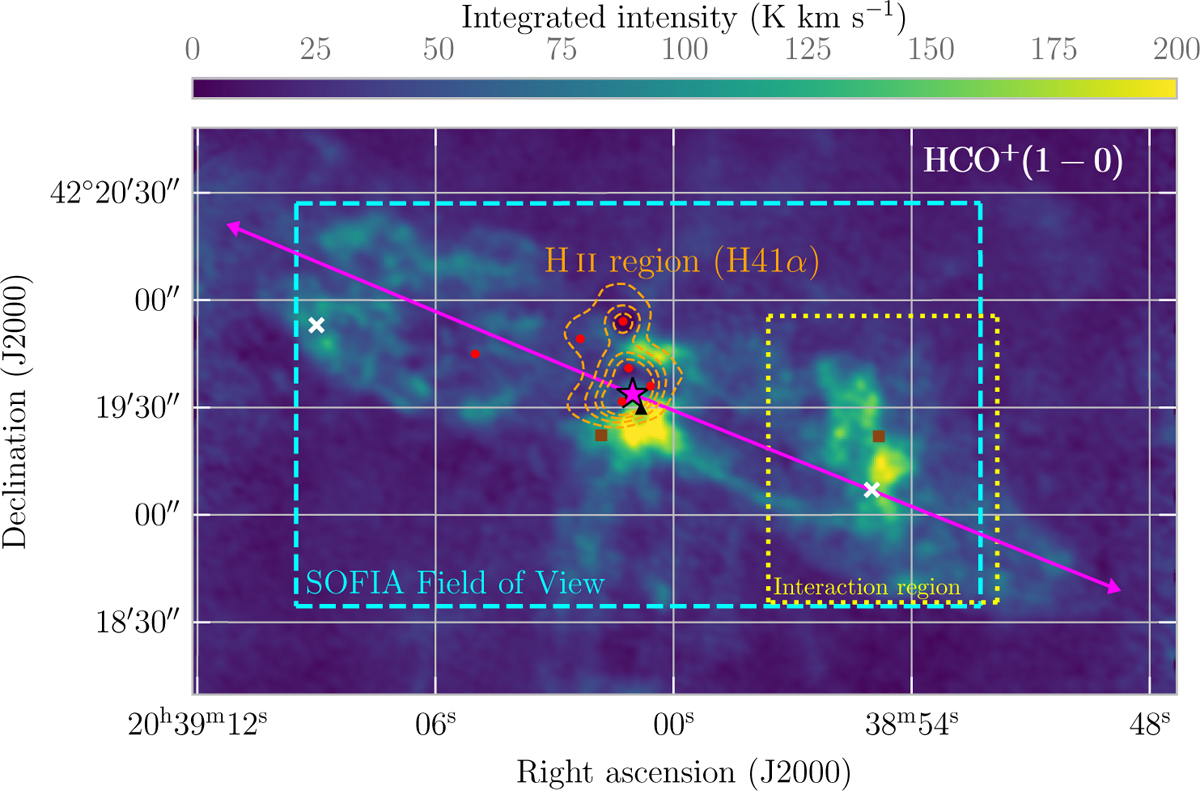
Overview of the DR21 Main high-mass star-forming region. Overlay of the H41α emission from DR21 integrated between −30 and 30 km s−1 (orange dashed contours) on HCO+ 1–0 observations (colors) from IRAM 30 m and NOEMA (beam sizes of 2.60′′ × 2.36′′ and 3.29′′ × 2.74′′, respectively; Skretas et al. 2023). The yellow rectangle shows the interaction region (Skretas et al. 2023), and the light blue rectangle shows the field of view of the FIFI-LS observations. The magenta star shows the center of the DR21-1 core at (α, δ)J2000=(20h39m01s.03,+42∘19′33′′.8) following Cao et al. (2019) and the magenta arrows the outflow direction based on the HCO+map (Skretas et al. 2023). The map also shows six positions of radio continuum sources identified as OB stars by Roelfsema et al. 1989 (red points), the 95 GHz methanol masers (brown squares) from Plambeck & Menten (1990), the 22 GHz H2 O maser (black triangle) from Genzel & Downes (1977), and the H2 peaks (white × symbols) (Garden et al. 1986).
Current usage metrics show cumulative count of Article Views (full-text article views including HTML views, PDF and ePub downloads, according to the available data) and Abstracts Views on Vision4Press platform.
Data correspond to usage on the plateform after 2015. The current usage metrics is available 48-96 hours after online publication and is updated daily on week days.
Initial download of the metrics may take a while.