Fig. 9.
Download original image
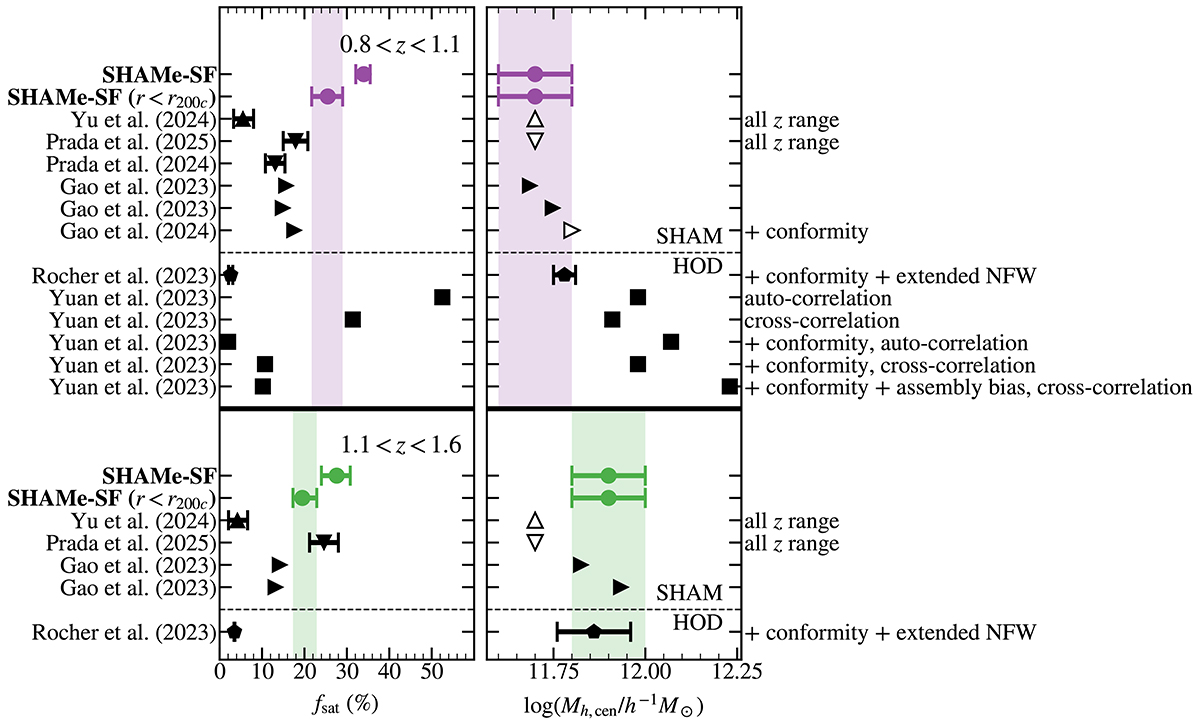
Satellite fractions (left) and average centrals halo mass (right) for different analyses of DESI ELGs (Rocher et al. 2023; Yu et al. 2024; Prada et al. 2025; Gao et al. 2023, 2024; Yuan et al. 2023) for the two redshift intervals analysed in this work (0.8 < z < 1.1, purple; 1.1 < z < 1.6, green). The dashed black line separates HODs and SHAM within each redshift bin. The satellite fractions are computed for subhaloes as Nsatellites/(Ncentrals + Nsatellites). When the average halo mass for centrals is not provided, we add the halo mass with the highest probability (white symbols). In the cases from Yu et al. (2024) and Prada et al. (2025), average halo occupations are computed for 0.8 < z < 1.6.
Current usage metrics show cumulative count of Article Views (full-text article views including HTML views, PDF and ePub downloads, according to the available data) and Abstracts Views on Vision4Press platform.
Data correspond to usage on the plateform after 2015. The current usage metrics is available 48-96 hours after online publication and is updated daily on week days.
Initial download of the metrics may take a while.