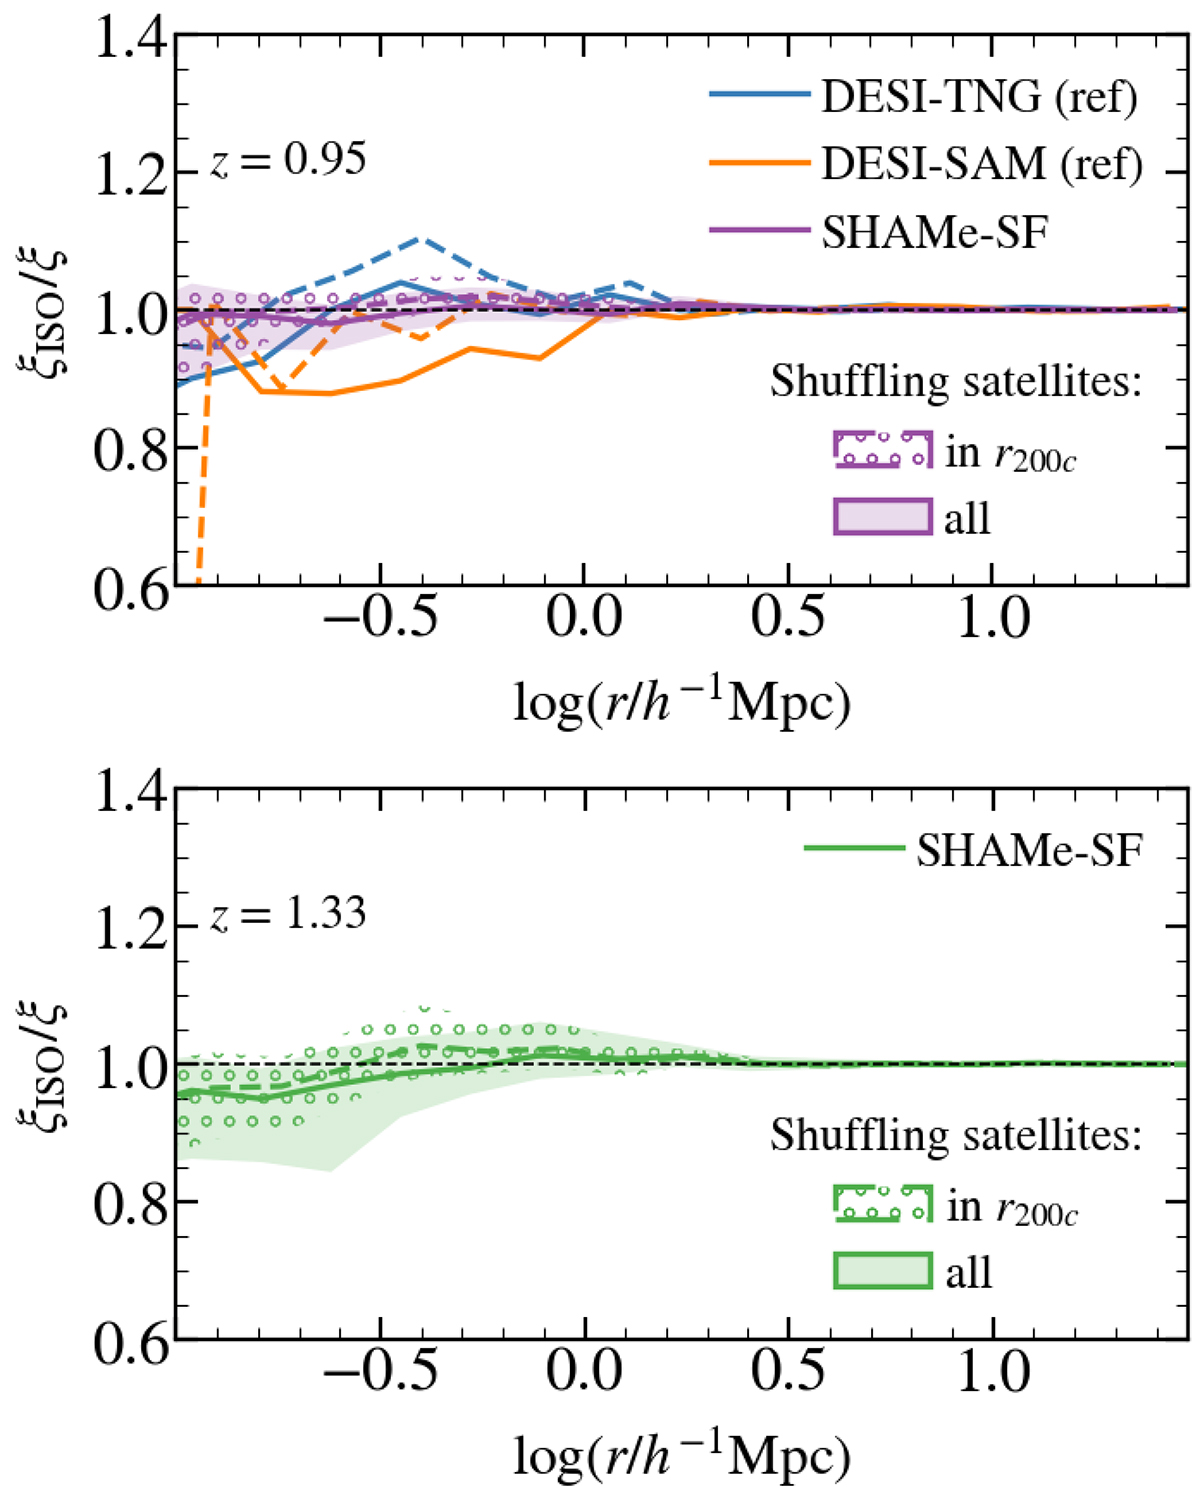
Fig. 7.
Download original image
Inferred magnitude of satellite anisotropy in the low-z and high-z DESI ELG catalogues. We display the ratio of the correlation function in the best-fit SHAMe catalogue to a version where the angular position of haloes has been randomly shuffled among each halo. Solid (dashed) lines and shaded (circle-hatched) regions indicate the mean and 1σ region after marginalisation over all SHAMe parameters when shuffling all satellites (only satellites within r200c). For comparison, we display the same quantity estimated in our mock DESI catalogues.
Current usage metrics show cumulative count of Article Views (full-text article views including HTML views, PDF and ePub downloads, according to the available data) and Abstracts Views on Vision4Press platform.
Data correspond to usage on the plateform after 2015. The current usage metrics is available 48-96 hours after online publication and is updated daily on week days.
Initial download of the metrics may take a while.