Fig. 6.
Download original image
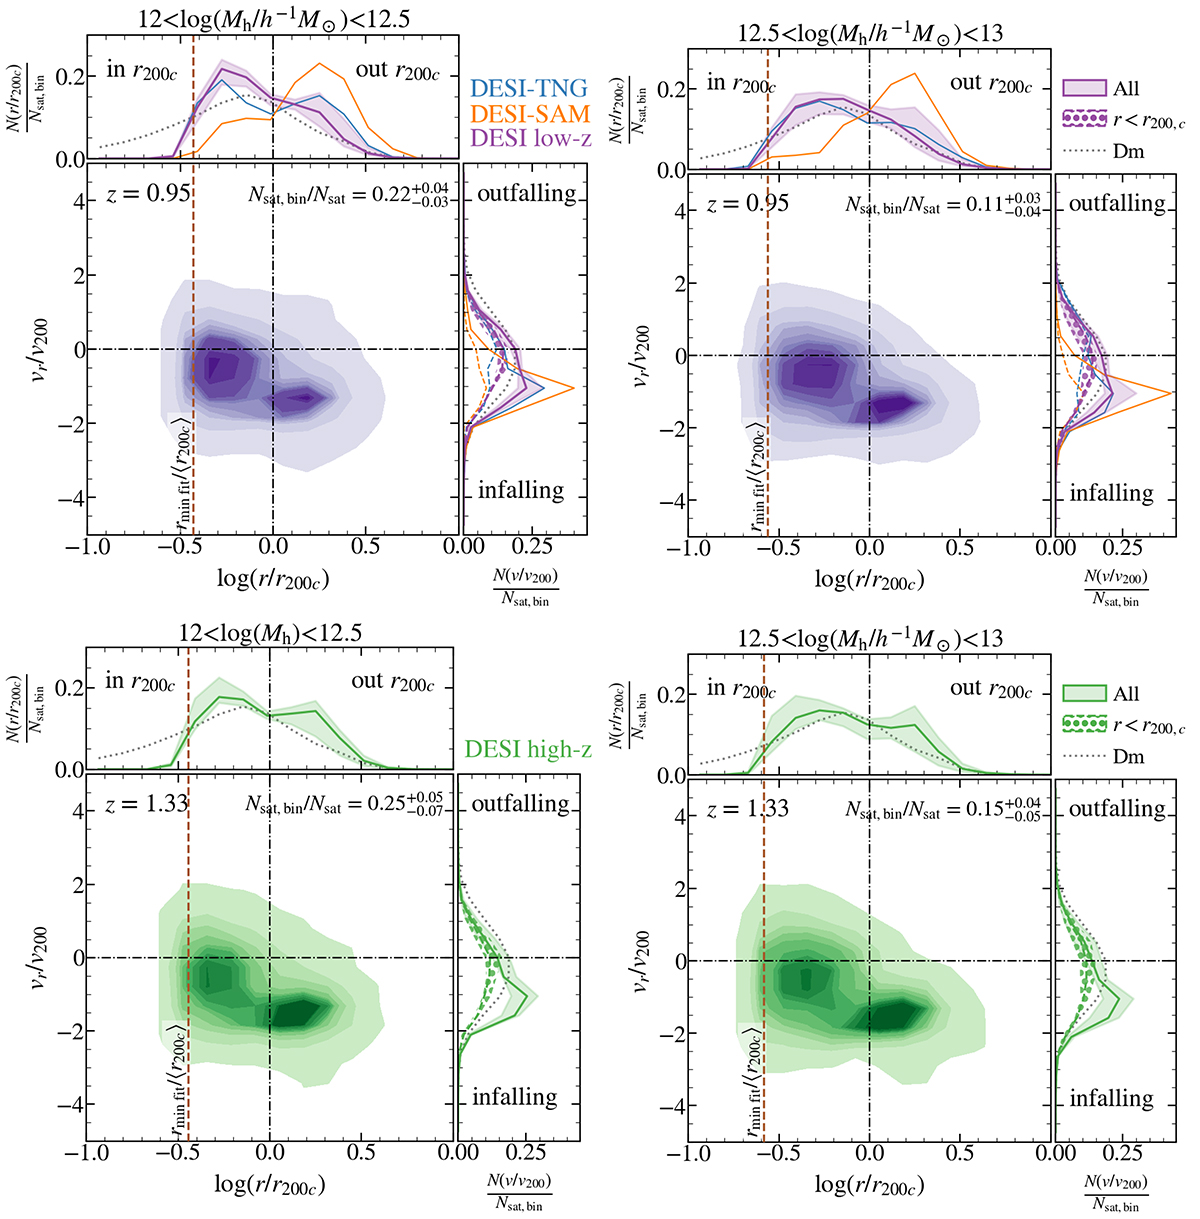
Inferred phase-space distribution of ELG satellites in the low-z and high-z DESI samples for two halo mass bins for satellites with r > 0.1 h−1 Mpc (the minimum scale up to which we fitted the clustering). The contours mark the regions (from darker to lighter) containing 10%, 20%, …, 90%, and 99% of the total satellites. The fraction of all the satellites with r > 0.1 h−1 Mpc inside mass bins is indicated in each panel. The dashed brown line indicates where this division is located for each halo mass bin. Note that the axes are normalised in units of the host halo, r200 and v200. For comparison, we show the distribution of velocities and halo-centric distances as measured in our mock DESI catalogues (orange and blue lines for DESI-SAM and DESI-TNG, respectively), and for randomly selected dark matter particles (dotted lines). Most of the satellites are hosted by haloes with log(Mh [h−1 M⊙]) < 13. For radial velocities, the dashed line and the circled-hatched region represent the median and 1σ distribution for satellites with r < r200c. We can distinguish two populations, one infalling outside r200c with a negative infall velocity and a population mainly within the halo boundary with a distribution of radial velocities skewed towards negative values (also infalling).
Current usage metrics show cumulative count of Article Views (full-text article views including HTML views, PDF and ePub downloads, according to the available data) and Abstracts Views on Vision4Press platform.
Data correspond to usage on the plateform after 2015. The current usage metrics is available 48-96 hours after online publication and is updated daily on week days.
Initial download of the metrics may take a while.