Fig. 4.
Download original image
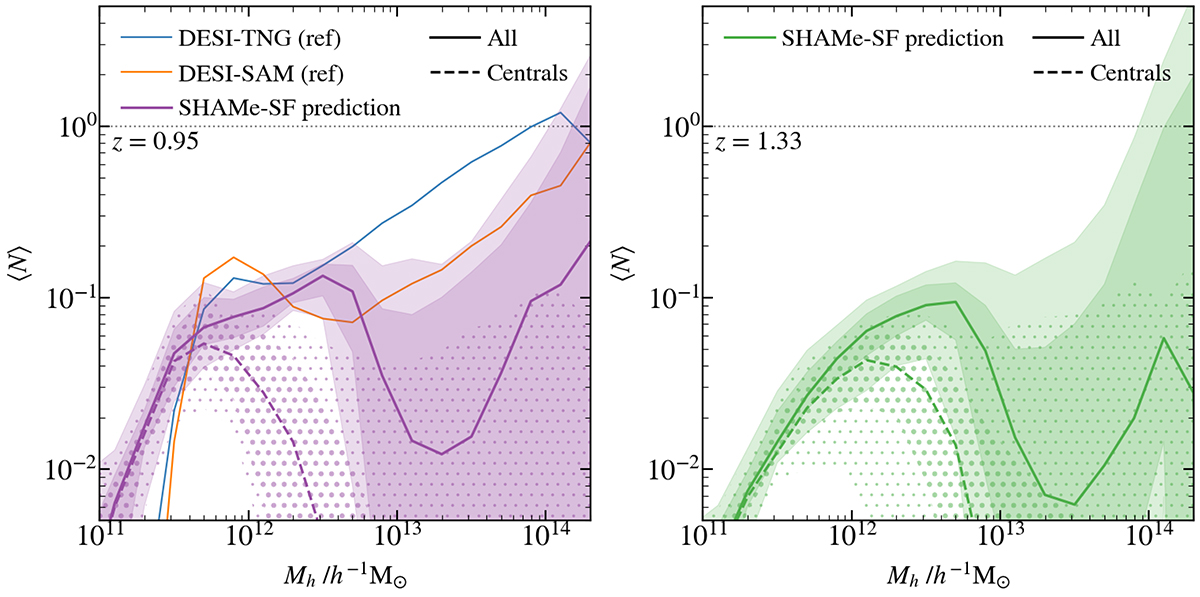
Inferred halo occupation number for galaxies in the low-z and high-z DESI ELG samples. The solid (dashed) lines show the median of our model after marginalisation over all the SHAMe-SF parameters, whereas shaded regions (small and large circles) show the 1σ and 2σ regions for all galaxies (centrals). We compare the measured occupation distributions in our two DESI ELG mocks. DESI ELGs have similar mean halo masses as our mock DESI catalogues (DESI-TNG and DESI-SAM), but the abundance of satellites is systematically lower. We add as a reference the dotted grey line, indicating an abundance of ⟨N⟩ = 1.
Current usage metrics show cumulative count of Article Views (full-text article views including HTML views, PDF and ePub downloads, according to the available data) and Abstracts Views on Vision4Press platform.
Data correspond to usage on the plateform after 2015. The current usage metrics is available 48-96 hours after online publication and is updated daily on week days.
Initial download of the metrics may take a while.