Fig. 2.
Download original image
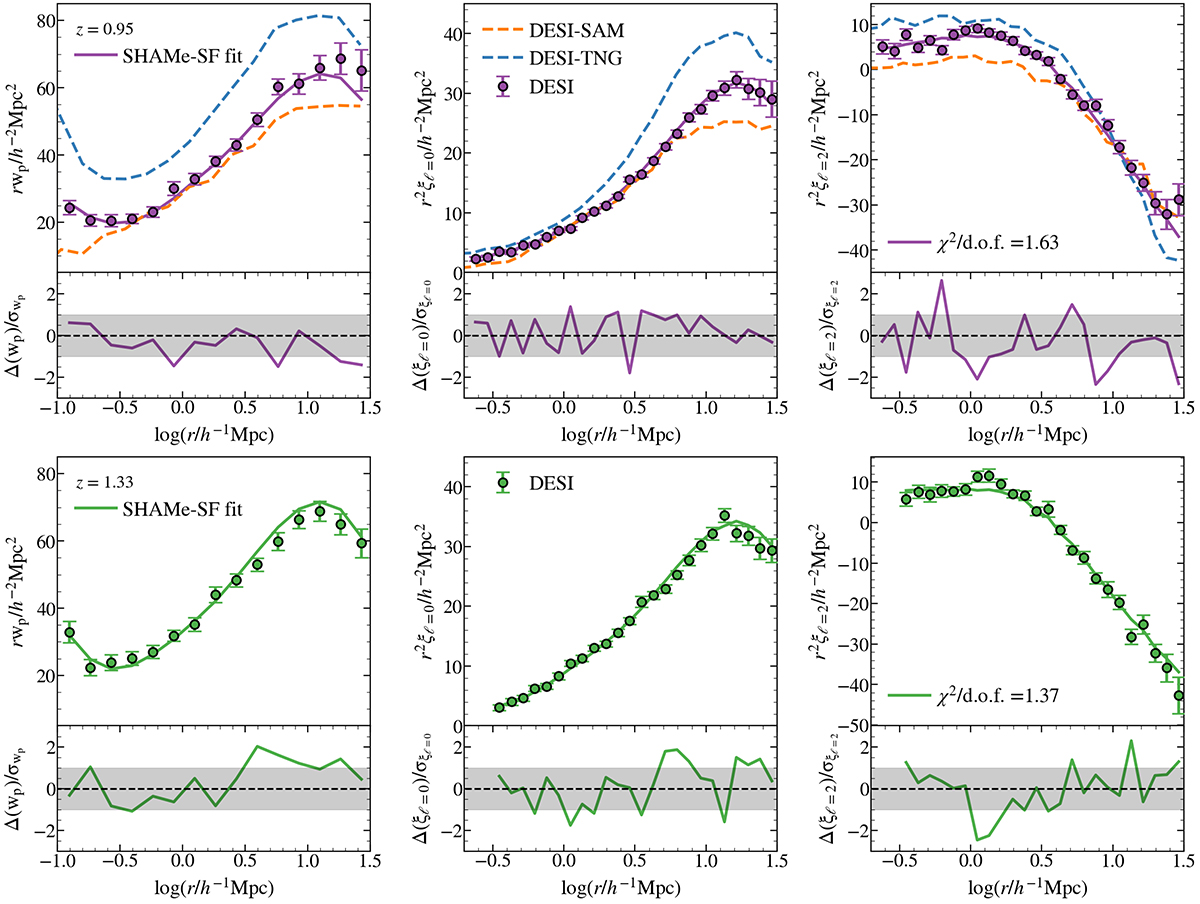
Projected correlation function (wp) and the monopole (ξℓ = 0) and quadrupole (ξℓ = 2) of the redshift–space correlation function of ELGs in DESI at z = 0.95 (top row) and at z = 1.33 (bottom row), together with the corresponding best-fit SHAMe-SF model (purple and green lines). Bottom panels: Difference between the data and the fit with SHAMe-SF in units of the diagonal elements of the respective covariance matrix. For comparison, we display the measurements for our DESI-TNG and DESI-SAM mock DESI catalogues at z = 1 as blue and orange lines, respectively. SHAMe-SF is a reasonably good description of the data for all the statistics and scales considered. Note that the data display fluctuations inconsistent with the error bars, which suggests there could be sources of noise that are not accounted for in the covariance matrices.
Current usage metrics show cumulative count of Article Views (full-text article views including HTML views, PDF and ePub downloads, according to the available data) and Abstracts Views on Vision4Press platform.
Data correspond to usage on the plateform after 2015. The current usage metrics is available 48-96 hours after online publication and is updated daily on week days.
Initial download of the metrics may take a while.