Open Access
Fig. A.5.
Download original image
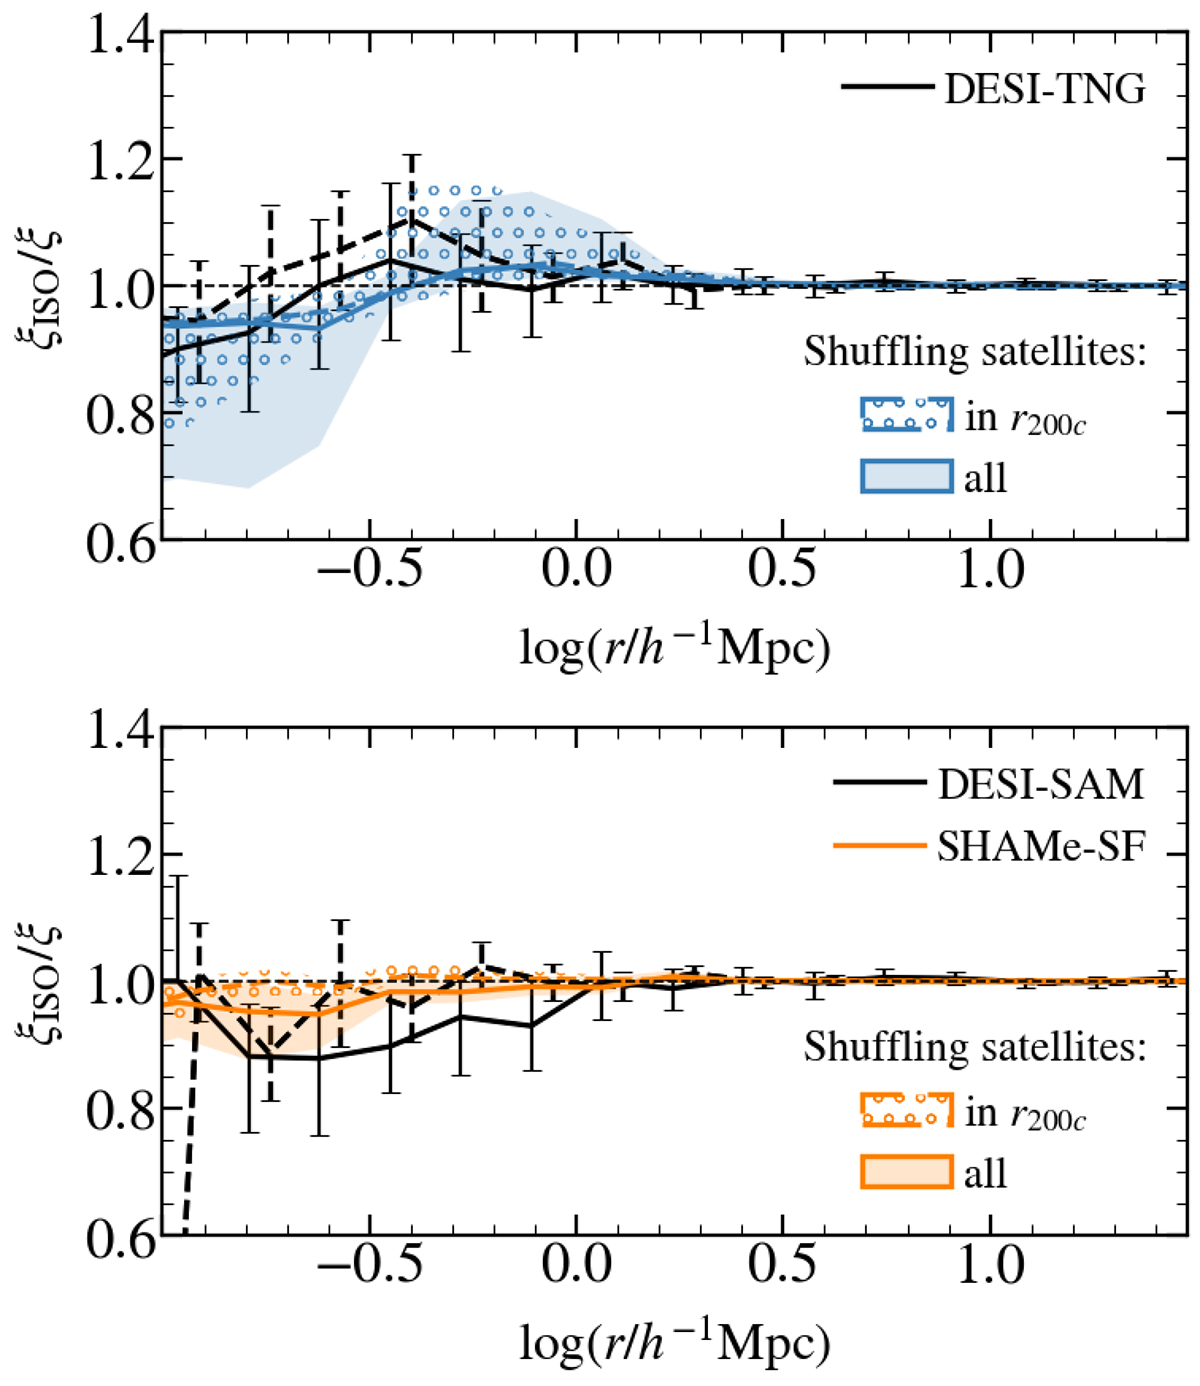
Quantification of the effect of the angular satellite distribution on the galaxy clustering (similar to Fig. 7). We mark the measurements from the mock DESI catalogues using the black lines: solid when all the satellites are shuffled, dashed when only the positions of satellites within r200c are changed.
Current usage metrics show cumulative count of Article Views (full-text article views including HTML views, PDF and ePub downloads, according to the available data) and Abstracts Views on Vision4Press platform.
Data correspond to usage on the plateform after 2015. The current usage metrics is available 48-96 hours after online publication and is updated daily on week days.
Initial download of the metrics may take a while.