Fig. A.4.
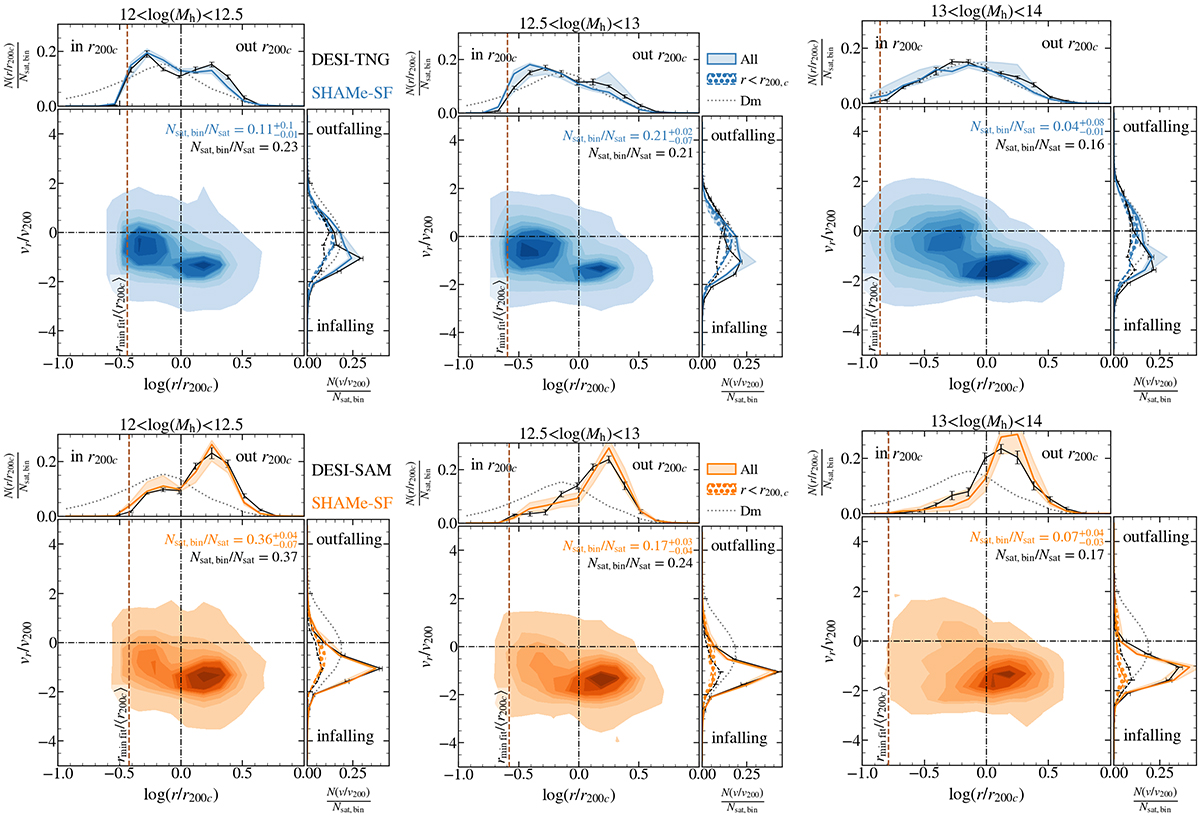
Download original image
Same as Fig. 6 but for the phase space of the central–satellite distance and the radial velocity of three bins in halo mass. We only include satellites with r > rmin fit. The measurements from the mock DESI catalogues are shown in black in the projected histograms, while the shaded regions mark our posterior predictive distributions. There is no difference between mass bins in DESI-SAM. For the highest-mass bin in the DESI-TNG sample, the satellite density profile closely follows the distribution of randomly selected particles. This is not the case for velocities.
Current usage metrics show cumulative count of Article Views (full-text article views including HTML views, PDF and ePub downloads, according to the available data) and Abstracts Views on Vision4Press platform.
Data correspond to usage on the plateform after 2015. The current usage metrics is available 48-96 hours after online publication and is updated daily on week days.
Initial download of the metrics may take a while.