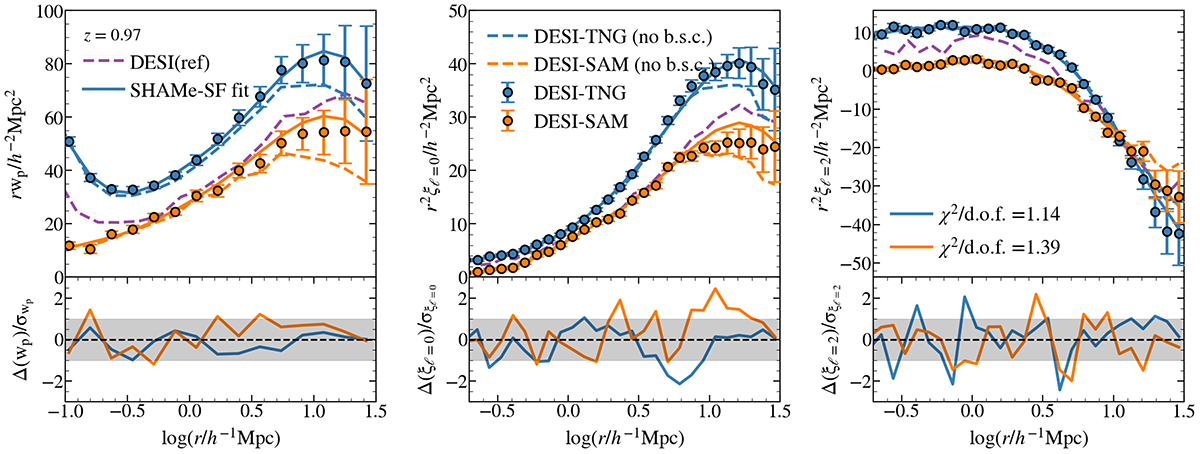
Fig. A.1.
Download original image
Projected correlation function (wp), and the monopole and quadrupole of the DESI-TNG (blue error bars) and DESI-SAM (orange error bars) ELGs at z = 1 defined using the selection criteria explained in Sect. 2.2.2. The solid lines show the corresponding best fit using the SHAMe-SF model. Lower panel: Relative difference between the fits and the data normalised by the uncertainty on the measurement, with the grey shaded region indicating 1σ. The dashed blue and orange lines show the measurements before the box-size correction (b.s.c.) introduced in Appendix A.1.2. The dashed purple line displays the measurements for DESI ELGs at 0.8 < z < 1.1 (Rocher et al. 2023) fitted in Fig. 2.
Current usage metrics show cumulative count of Article Views (full-text article views including HTML views, PDF and ePub downloads, according to the available data) and Abstracts Views on Vision4Press platform.
Data correspond to usage on the plateform after 2015. The current usage metrics is available 48-96 hours after online publication and is updated daily on week days.
Initial download of the metrics may take a while.