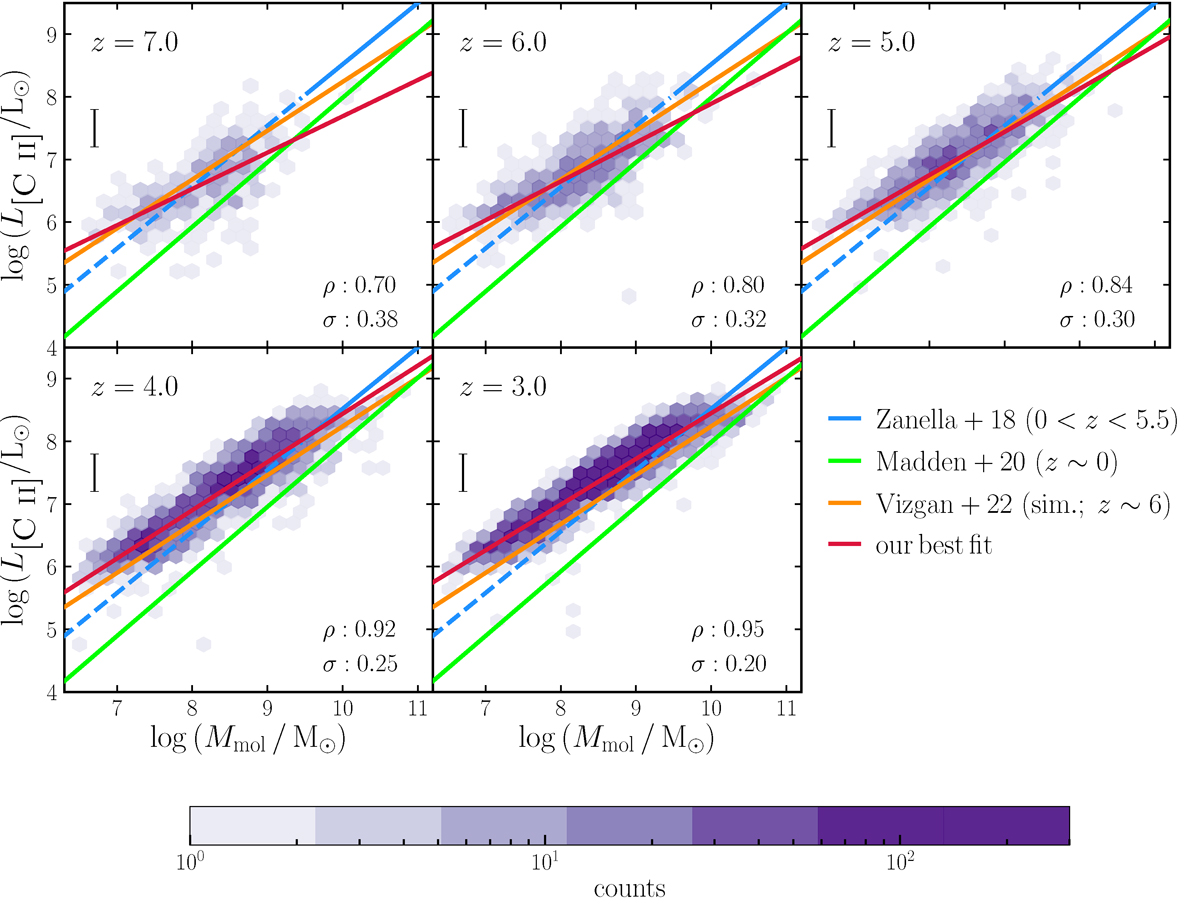
Fig. 9.
Download original image
[C II]−Mmol relation from our simulations compared with observations. The simulated galaxies are represented by purple hexbins, where the colour indicates the number of galaxies in each bin. The solid red line gives the ordinary least squares linear fit to these galaxies, with the fit parameters listed in Table 3. In each panel, we report the Spearman’s rank correlation coefficient (ρ) and the 1σ scatter around the best-fit relation. The best fit to the observed galaxy sample at z = 0 − 5.5 by Zanella et al. (2018) is shown in blue and the fit to the z ∼ 0 dwarf galaxies (Madden et al. 2020) is shown in lime. The relation from SIMBA simulations at z = 6 (Vizgan et al. 2022) is shown in orange. As in Fig. 7, the extrapolated Zanella et al. (2018) relation is shown as a dashed line of the same colour.
Current usage metrics show cumulative count of Article Views (full-text article views including HTML views, PDF and ePub downloads, according to the available data) and Abstracts Views on Vision4Press platform.
Data correspond to usage on the plateform after 2015. The current usage metrics is available 48-96 hours after online publication and is updated daily on week days.
Initial download of the metrics may take a while.